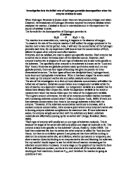
Below are the results from my pre-test.
These results show that as the concentration of H2O2 increased, the amount of O2 collected increased. This means that my prediction is most likely to be correct although there is a chance that the results above are anomalous as the results were only taken once and not three times like they will be in the actual test.
A prediction is important as it provides a chance to see what will happen in the experiment and gives the opportunity for any errors, with the way the experiment is carried out or with the materials used, to be changed before the proper experiment is carried out.
For the experiment a measuring cylinder in a water bath will collect the O2 given off. In the boiling tube will be a piece of tubing that the O2 will pass through and then it will collect in the measuring cylinder. Every 10 seconds for 2 minutes the O2 collected will be recorded so that the rate of reaction can be worked out. To alter the substrate concentration, the H2O2 will be mixed with water. The first experiment will contain 1ml of H2O2 and 4ml of water, and then the second will have 2mls of H2O2 and 3ml of water. Using 5ml of solution means that it is easy to change concentration, decreasing one by a fifth and increasing the other by a fifth. Throughout the experiment a water bath will keep the temperature at a constant of 37°C. This ensures that the experiment is fair as each one will be carried out at the same temperature, necessary because temperature affects the rate of an enzyme reaction. Each experiment will be carried out three times so that any anomalous results will be obvious. The data that is collected will be put into results tables and then a graph will be produced with Time in seconds on the x-axis and O2 collected on the y-axis.
When using Hydrogen Peroxide it is important that many aspects of safety are observed. H2O2 is corrosive and can cause burns in concentrations of 5.9M and irritation to skin and eyes in concentrations stronger or equal to 1.5M. Therefore it is important to wear goggles to protect the eyes, and a lab coat to protect skin. If the H2O2 does get onto the skin or clothes then, if in large quantities, remove the clothing and wash the area of skin with lots of water. If H2O2 gets into the eyes then the eyes must be rinsed for 10-15 minutes and then medical attention should be sought. With any chemical it should not be swallowed. However, if it is swallowed then the mouth should be washed out and 2-3 glasses of water should be drunk. Also it is important to seek medical attention as H2O2 can cause the release of oxygen internally and this would cause a lot of damage to vital organs. If H2O2 is spilled then it should be covered with a mineral absorbent and then diluted with water.
My results are as follows:
To work out the averages of the data the 1st, 2nd and 3rd values were added together and then divided by three.
For example:
Average = 16 + 16 + 12 = 14.66 = 14.7cm3 (to 1dp)
3
For each of the results tables a graph has been drawn. These graphs show the best-fit curves, highlight any anomalous results and have the initial rates of reaction on.
To work out the initial rate of reaction a time, at which the initial rate of reaction will be measured, is taken. Then a line is drawn from where the best-fit curve begins to curve; meaning the reaction is slowing down. Where this line crosses the chosen time, in my case 90seconds, the amount of O2 collected is taken. This number is then divided by the time it was taken and this gives the initial rate of reaction.
For example:
If the O2 collected was 50cm3 and the time was 100seconds then…
50 = 0.50cm3/sec (to 3sf)
100
So the initial rate of reaction would be 0.5cm3/sec.
Table showing the initial rates of reaction for each experiment.
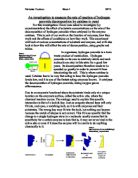
By looking at my initial rate of reaction graphs I can clearly see that as the concentration of substrate increased, so did the initial rate of reaction. This happens because there is more chance for a collision between an enzyme’s active site and a substrate so the initial rate of reaction will be a lot higher where there are many collisions.
When looking at the initial rates of reaction above, there is a clear increase from 1ml of H2O2 at 0.18cm3/sec to 5mls of H2O2 at 0.88cm3/sec. However, at 2mls of H2O2 the initial rate of reaction is higher than that of the H2O2 at 3mls and 4mls of H2O2.
Also in the experiments with 1ml, 3mls, 4mls and 5mls the total O2 collected increased. However, as in the initial rate of reaction when the H2O2 was 2mls the volume of O2 collected was higher than with 3 and 4mls of H2O2. The total O2 collected was averaged 37.3cm3 in the 2ml experiment, while in the 3ml experiment the average total was 29.7cm3. The 4ml experiment had an average total of 32cm3.
One thing I noticed with my experiment is that the 1st to the 2nd measurement was much slower than the start to the 1st measurement. I think this was caused by air already in the tube being pushed out. To overcome this I could have measured how much O2 started in the tube and then subtracted that from my 1st measurement.
My experiment was good because it was repeated enough times, three times, so that any anomalous results could be clearly seen next to a best-fit curve. Also all of my results had a best-fit curve and the values increased throughout, backing up my prediction that as the substrate concentration increased so would the initial rate of reaction. Using a measuring cylinder rather than a gas syringe to collect the O2 is better because gas syringes, although easier to use, do not always move with ease when oxygen moves in. In my experiment the oxygen bubbles could be clearly seen in the water inside the measuring cylinder and had no trouble reaching the cylinder.
The results that I gathered, in my opinion, are not all reliable. This is mainly due to the wide range of results gathered in my 5ml H2O2, the final measurements being 45cm3, 93cm3 and 92cm3. Also, my 2ml H2O2 experiment ended up with a higher initial rate of reaction and more O2 collected than the 3ml H2O2 and the 4ml H2O2 experiments. Repeating the experiment 3 times and then taking an average helps to hide these unreliable results.
Another reason why my results are unreliable is that the surface area was not the same each time. If the yeast in one experiment had a much higher surface area then it was going to have a much faster initial rate of reaction than an experiment where yeast had a small surface area. This is likely to be why my 2ml H2O2 experiment came out higher than my 3ml and 4ml H2O2 experiments
On my graphs I have circled what I think are anomalous results. My first anomalies occur on my 2ml H2O2 graph. Between 40seconds and 60seconds the O2 collected is 14.3cm3, 17.7cm3 and 21.7cm3. I think that, although the graph on the whole is unreliable, these are anomalous because they do not fit the best-fit curve. On the 3ml H2O2 graphs I have circled two points as these points dip below the best fit curve and then back up again. At 70seconds and 80seconds the O2 collected is 20.7cm3 and 22.7cm3. A possible reason for this could have been that the tube might have been blocked, maybe by the way that the measuring cylinder was held. It might have been different if the measuring cylinder was clamped so it couldn’t move and therefore couldn’t squash the tube. By holding the measuring cylinder it was possible that it may have been pressed down on the tube briefly. This would of held the O2 in the tube and then when it was released the O2 would have all come out at once, resulting in the points moving back to the best-fit line. On the 5ml H2O2 graph I have circled one point. This point is after 30seconds and misses the best-fit curve by about 4cm3; it has 30cm3 whereas the curve crosses 30seconds at 34cm3. The reason for this anomaly could have been the same as above or possible because of a reading inaccuracy. Also, when holding the measuring cylinder, it was not always held perfectly upright, and therefore could have given a false reading but this is likely to have been the same throughout the experiment.
Bibliography
These are the books from which I gathered my information and used to make my prediction:
Indge, Rowland, Baker, (2000): A New Introduction to Biology (Hodder & Stroughton)
Jones, Forsbery and Taylor (2000): Biology 1 (Cambridge University Press)
Toole, Glenn and Susan (1999): Understanding Biology, Fourth Edition: (Stanley Thorne Ltd)