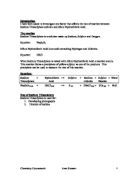
Which variable I chose
As this reaction occurs in a solution it would not be possible to change the surface area or pressure and there is no known catalyst for this reaction. This means I could look at either concentration or temperature.
I will look at concentration in this experiment. I think that if I double the concentration of sodium thiosulphate I will double the rate of reaction as there will be twice as many particles in the same volume, so twice as many collisions can occur and the reactions will be twice as fast.
Preliminary experiment
Aim: To find appropriate concentrations of sodium thiosulphate that will provide us with a suitable set of results and form a good graph.
The volume of HCL is going to be kept at a constant of 20mls.
The solution of sodium thiosulphate we have been provided with has a concentration of o.2 moles per dm3
To work out what concentrations of each I need I will use the following equations:
Volume sodium thiosulphate= concentration required X total volume solution
Original concentration (0.2)
Volume of water= total volume solution – volume sodium thiosulphate
Volume of ST.= 0.025 X 40ml = 5ml
0.2
Volume of water = 40ml – 5m l = 35ml
Volume of ST.= 0.05 X 40ml = 10ml
0.2
Volume of water= 40ml – 10ml = 30ml
Volume of ST.= 0.075 X 40ml = 15ml
0.2
Volume of water= 40ml – 15ml = 25ml
Volume of ST.= 0.1 X 40ml = 20ml
0.2
Volume of water= 40ml – 20ml =20ml
Volume of ST.= 0.125 X 40ml = 25ml
0.2
Volume of water= 40ml – 25ml =15ml
Method
Firstly I measured the right amount of Hydrochloric acid and sodium thiosulphate into two different test-tubes. These were then mixed together in a beaker which was placed on top of a piece of laminated paper with a cross drawn on. The temperature was then taken using a thermometer. As soon as the H2O was added, the stopwatch was started. We then timed how long it would take for so much sulphur to be produced that the cross could no longer be seen through the solution. This was repeated for all the different amounts.
Result
Conclusion
These concentrates gave us a good set of results although the time taken between 0.025 and 0.05 is a big difference, however we decided it gave us a good graph and so we chose to use those as our chosen concentrates.
How I plan to do the experiment
Apparatus
Sodium thiosulphate (NA SO)
Hydrochloric acid (HCL)
Water (H20)
Paper marked with a cross
Measuring cylinder (x2)
Beaker (x2)
Stopwatch
Thermometer
Method
I will measure the sodium thiosulphate and hydrochloric acid in to two separate measuring cylinders. I will then pour them both into the same beaker which I will have placed on the paper marked with a cross. I will record the temperature of the solution using the thermometer. Next I will add the correct volume of H20 and start the timer as soon as it is added. I will continuously look down on the beaker until I am no longer able to see the cross marked on the paper through the solution at which I will stop the timer and record the time the rate of reaction took.
I will do the same thing for all of the other concentrates.
How will I get accurate results?
I will make my results as accurate as possible by measuring the volumes with a burette, timing to the nearest second and by measuring the temperature of the solution before I start.
I will repeat each reading three times to ensure my results are reliable and to eliminate any anomalous results, which I will then average out.
How I will make it a fair test
So that I am able to accurately compare the readings I have taken, my tests must be fair, I will ensure they are fair by:
- The only thing that I will change will be the concentration of the sodium thiosulphate.
- Taking the temperature before I begin, according to the collision theory and what factors affect the rate of reaction, as temperature increases so does the kinetic energy of the particles. If the solutions had had a higher temperature then another, it would have been unfair as it could cause the reaction to occur quicker.
- The glassware will always be cleaned when being used again, so there won’t be anything remaining in it.
- I will always use the same cross each time. If I didn’t and the cross was used with different pens or even different paper, it may show up stronger then another cross, so the cross may disappear in a longer or shorter time because of that.
Safety precautions
- Always wear a labcoat
- Wear safety googles
- Wash hands if come into contact with any chemicals
- Be careful of fumes given off by sulphur
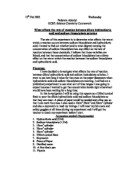
Measuring rate of reaction
Once I have my results, I will be able to compare the rate of reaction.
Rate of reaction= amount of sulphur formed
Time for “X” to disappear
As the amount of sulphur is constant:
Rate of reaction = 1
t
I can take my results and put them in this equation to work out the reaction rate, if the mixture with the highest concentration was the quickest then my prediction will be correct.
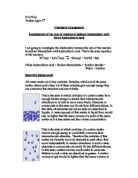
Experiment
Prediction
Based on my knowledge on different factors affecting rates of reaction I think that as concentration increases so will the rate of reaction. I think that my results will produce a proportional graph.
Diagram
Method
As shown in the diagram, I measured the sodium thiosulphate and hydrochloric acid in to two separate measuring cylinders. I then poured them both into the same beaker, which I had placed onto a piece of laminated paper marked with a cross. I then recorded the temperature of the solution using the thermometer. Next I added the H20 and started the timer as soon as it was added. I continuously looked down on the beaker until I was no longer able to see the cross marked on the paper through the solution, at which I stopped the timer and recorded the time it took for the solution to turn opaque.
I did the same thing for all of the other concentrates.
I made my results as accurate as possible by measuring the volumes with a burette, timing to the nearest second and by measuring the temperature of the solution before I start.
I repeated each reading three times to ensure my results were reliable and to eliminate any anomalous results, which I then averaged out.
Results
Rate of reaction = 1
t
Average rate of reaction
Analysing evidence and drawing conclusions
Now that I have obtained all my results and drawn up graphs, I can check to see if my prediction was correct or not.
Analysing evidence and drawing conclusions
All results have now been obtained and they seem to be quite good, all showing correlation. As was hoped at the start, a repeat was managed for each test and an average worked out from those figures. The results were recorded with decimal place and the averages and rate of reactions are to two decimal places. The rate of reaction is the key thing being looked at in this experiment and this is how it was calculated:
1
Time taken for cross to be obscured
This figure was then multiplied by 1000 to make it easier to deal with. The figures have all been rounded to two decimal places.
My predictions have been correct. When the concentration of the sodium thiosulphate has gone up, as the first part of the experiment shows, the rate of reaction goes up. When the temperature goes up, as the second results table shows, so does the rate of reaction. This is what was expected and therefore makes it highly unlikely that there have been any major mistakes, although all results are obviously not perfect.
The next three pages are graphs. Graphs one and two relate to the first table of results and graph three relates to the second table. The reason there are two graphs for the first table is that one shows time taken for cross to be obscured and the other shows rate of reaction. Rate of reaction is what is being investigated and so only a rate of reaction graph was needed for table two. There are two graphs for the first results table to show the difference in time taken and rate of reaction i.e. the time taken for cross to be obscured shows negative correlation while graph two shows positive correlation. By drawing a line of best fit on the rate of reaction graphs, we can see that there are no results that are obviously completely wrong. With both graphs the last result is suprisingly high, and this can be seen on the results table as well.
Evaluating Evidence
The procedure used was good and produced good results but it could have been improved and these will be listed later. The results are mainly good, there are no odd results and everything came out as expected. This could mean that the experiment was done perfectly but it doesn´t. Although all the average times and rates of reaction all conform to a pattern, they are not all evenly spaced and therefore are probably not perfect. As an example, in the first experiment, where the temperature was being varied, the rates of reaction of 30 C and 40 C were 26.18secs and 26.56secs respectively. This was only an increase of 0.38secs compared to an increase of 90.09secs for 60 C to 70 C (from 90.09secs to 180.18secs ). Clearly this is an enormous difference and disproportionate. The results could be correct but the results do appear to nearly double each time, except for in this instance. There are similar examples from the second experiment but they are not as obvious.
Improvements that could be made if the experiment was repeated:
When doing the results that took less time (some took around five seconds), it would have been more accurate to have two people so one person could put the substances together while the other person started timing
Obviously it would have been good to have done more repeats. Two tests were managed each time but if one had been wrong this could have dramatically changed the average time and therefore rate of reaction.
Increasing the surface area of a reactant will increase the rate of a reaction. This is because the reacting particles can only collide with he surface of the solid and the particles within the solid cannot react until those on the surface have reacted and moved away. Powdered calcium carbonate has a much larger surface are than the same mass of marble chips and therefore will react more quickly.
All in all I think this was a good experiment and the best that could have been done with the time and resources available. The results supported my predictions and they seem to be fairly reliable results.