Increasing
Concentration
This will happen because the concentrations of the particles are higher, which will cause the particles to bump into each other more frequently. Each time you increase the concentration, you’re increasing the collision between the particles. Therefore, you’re increasing the rate of reactions.
Apparatus
- Conical flask
- Gas syringe
- Standard Clamp
- Stop clock
- Manganese (iv) oxide
- Hydrogen peroxide
- Measuring Cylinder
Diagram
Method
I will set up the apparatus as shown in the diagram. I will then, measure 50cm3 of hydrogen peroxide solution, using a measuring cylinder and pour this into the conical flask. I will then add half a spatula of Manganese (iv) oxide and immediately replacing the bung and start the stop clock. I will record the volume of oxygen collected at intervals of 30 seconds. In between each experiment, I will push the syringe back because during the reaction the amount of oxygen produce tends to push the syringe forward. And also after each experiment, I should wash out the manganese oxide left behind in the conical flakes I will repeat this procedure for each concentration of h2o2 and then I will repeat the whole thing another 3 times.
It will be a fair test because I will be using the same apparatus e.g. conical flask, same measurement of hydrogen peroxide and manganese (iv) oxide etc. I’ll be following the method accurately and measuring the volume of oxygen every 30seconds.
Concentration 0.2M
Concentration 0.3M
Concentration 0.4M
Concentration 0.5M
Concentration 0.6M
* = Odd results
Calculating the gradient
0.2M
11cm3/30s = 0.37cm3/s
0.3M
20cm3/30s = 0.67cm/s
0.4M
29cm3/30s = 0.97cm3/s
0.5M
37cm3/30s = 1.23cm3/s
0.6M
47cm3/30s = 1.57cm3/s
Evaluations
My results are accurate because I obtained it by repeating it each concentration three times. This meant I could identify any odd result and calculate the average, my result were not completely reliable because I obtained one or two odd results.
My results were good enough to support a firm conclusion. Which was the higher concentration, the more particles you have crowded together. This means the particles have greater chance of colliding. Because there are more collisions, the reaction rate is greater. In the reaction, the result shows the rate change with time.
Referring to the results, the averages of 0.6 and 0.5 H2O2 solution were similar. This problem was visual displayed on graph. The graph, presents these averages as lines nearly touching each and when the got to 2 minutes they met and also the lines were close to the lines of best fit.
A problem that occurred, when I did the practical was I worked alone. This made it harder for me to turn on the stop clock at the exact time. I added Manganese oxide to the hydrogen peroxide solution. Another problem was it was difficult to measure the exact amount of Manganese peroxide using a spatula. When I was adding it to the hydrogen peroxide. Also another thing, which I experience, was it was hard to get the right amount of Manganese peroxide using a spatula; this would have affected how fair the test was sometimes more catalyst sometimes less. Basically, if the there’s more catalyst, you have a higher surface area which faster the rate of reaction. On the other hand, if you have less catalyst, you will have low surface area and rate of reaction is slow.
To improve my method, I could have work with my partner, who would help turn on the stop clock on the exact time, the Manganese peroxide was added to hydrogen peroxide. Another improvement is, I could over come the problem with the variable amount of Manganese oxide, by using a fixed 1g weight to collect the right amount of Manganese oxide. I could have used a fresh Conical flakes for each experiment because there don’t have water in them, that might dilute the concentration and make it weaker, where as, if you washed the conical flakes after each experiment, the might be traces of water left behind.
Second factors that I could investigate in the experiment could be temperature, surface area and catalyst.
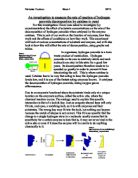
Temperature - At higher temperature, Particles are moving faster, so there is more collision. Also (and more importantly), the collisions are more energetic. More collisions have energy greater than the activation energy. So the reaction is faster.
Surface area – with a grater surface area of collision are far more frequent. Because there are more collisions, the reaction rate is greater.
Catalyst – the catalyst seem to lower the activation energy for the reaction. Many more collisions are ‘successful’, and the reaction is faster. Exactly how the catalyst achieves this remains a mystery for many reactions.
When I look back at my prediction I could see my result and what I predicted were some concentration did increase with time, eventually at a point where it got used up.
Looking at my result I can see that the rate changes with time. The graph is steepest at the start of the experiment, showing the rate of the reaction is greater than. As the reaction continues, the rate decreases until, eventually. The reaction stops. This is happening because in the solution of higher concentration and in gases of higher pressure, particles are closer together. They have a greater chance of colliding because they are more collisions, that rate of reactions greater.
Conclusion
In the experiment I have investigated how different levels of concentration affect the rate of reaction. After I finish my experiments, I found out a pattern of result on my graph and data. Which was as the concentration level increases, the rate of reaction also increases. In solution of higher concentration, the particles are crowded together. They have a greater chance of colliding. Because there are more collisions, the reaction rate is greater.