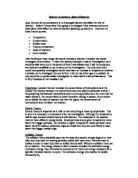
Here is a diagram to back up my prediction:
As further evidence to support my prediction below is a preliminary investigation showing how increasing concentration increases reaction. The table below shows the results that were collected from the investigation, which involved: changing the concentration of hydrochloric acid so that the reaction rate between calcium carbonate will change.
In the experiment as the hydrochloric acid is diluted the reaction partials become more spread out so they will have to travel further before they can react. The table below shows the result taken it is clear from this that the longer the reaction takes the slower it is. The rate of reaction is “inversely proportional” to the time taken. This means:
Rate of reaction is proportional to 1
Time
Method:
- To decide what factor I am going to investigate to prove rates of reaction.
- When chosen concentration as my investigation, decide what measurements of the 3 substances I will be using are.
- Draw up a results table with my measurements for my 5 experiments and how they differ from experiment 1 to 5. I am taking 5 readings so that my results are more reliable.
- Get a measuring cylinder and fill it with 30ml of solution A, pour it into a conical flask. Do the same for water, first of all measuring 5ml and then adding 25ml of solution B to the same flask as the water. I will be using a measuring cylinder that’s capacity is 30ml for solution A as this makes my measurements more reliable. I will be doing the same with the other solution that I need to measure.
- Add the flask with the water and solution B to the flask with solution A when I have poured it all in start timing with a stopwatch.
- Time the experiment until the solution turns black then stop the clock and record the time that it took to perform a reaction in my results table.
- I will continue to do this until I have results for all 5 experiments however for experiment 2 I will add 10ml of water and 20ml of Solution B I will continue to decrease the amount of solution B and increase the amount of water by 5ml for the whole investigation.
- When I have completed my first set of results I will do the same to gather another set of results so that I can compare them. If I have anomalies I will do the investigation again until I have results that look similar and I can average out.
- Then I will find out the rate of reaction I will do this by finding the average time for each experiment by adding all of experiment 1 from each investigation and finding the mean. Then I will divide 1/ the average time for each experiment.
- After completing a final results table with average times for each experiment and with the rate of reaction I will write my conclusion discovering if my hypothesis was right and then plot a line graph and evaluate my coursework.
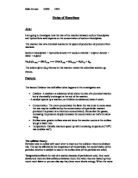
To make sure my investigation is fair I am going to use all the same equipment I am going to have the same person timing so we have fair stop and start points. We will use the same measuring cylinders also that we always get the same measurements. I have chosen measuring cylinders that hold the specific amount of solutions and water I need to make my investigation more reliable. Although I will be varying my concentration I will be keeping the temperature, particle size and quantity of solution A the same. I will be keeping the temperature the same as an increases temperature speeds up the reaction which would interfere with the results of my investigation and chosen variable. The stop watch I will use with measure seconds to 0.01 seconds this will not only make my investigation fair as I will be using the same equipment through out but it will also help to support my final results. I will be carrying out the investigation 4 or 5 times to make sure my results are reliable and that I can prove my prediction is right by them.
Here is a labelled diagram of what I will be using to carry out my investigation.
Results:
Investigation 1:
Investigation 2:
Investigation 3:
Investigation 4:
I have carried out a scientific investigation that is designed to prove whether or not doubling the concentration doubles the rate of reaction to do this I followed my plan that I made before hand.
I carried out the investigation 4 more times as in the first investigation I had 3 anomalies in compassion to my seconds set of results. This could be due to the fact that the solution A I was using was coming towards the end of its portion. Therefore the starch solution in solution A was not very good and could have gone mouldy. This would explain why the results for experiment 5 for my investigations are slow in comparison to investigation 1. I have therefore highlighted my anomalies and have not included them whilst working out the rate of reaction for each experiment and sets of measurements.
The table that follows is my final tables complete with rate of reaction figures:
The sums below show how I worked out my rate of reaction following the rate of reaction formula: 1/time:
Average Experiment 1:
11+11+9+8=39
39-4=9.75
Rate of reaction experiment 1:
1/9.75=0.10
Average Experiment 2:
20+15+19+16=70
70/4=17.5
Rate of reaction experiment 2:
1/17.5=0.06
Average Experiment 3:
23+32+23=78
78/3=19.5
Rate of reaction experiment 3:
1/19.5=0.04
Average Experiment 4:
162+253+154=569
569/3=189.7
Rate of reaction experiment 4:
1/189.7=0.005
Average Experiment 5:
505+423+516=1444
144/3=480.7
Rate of reaction experiment 5:
1/480.7=0.002
Conclusion:
So my results prove that the higher the concentration the faster the rate of reaction. And the more diluted Solution B was, the slower the rate of reaction was. Both my tables and my workings out show and support my prediction. My graph does create a best fit however, the shape of the graph I would expect the results to make would be:
However, mine is a curved shape of best fit. This is because I have anomalies within my results, although I have not included the anomalies that I highlighted my results were always unlikely to create a graph that was exactly correct to what a graph showing the results of a concentration investigation should look like.
Instead my graph shows that the rate of reaction was slower at first then however the measurement of solution B in comparison to the water creates an effect which is shown by a steep curve in my line of best fit.
Two possible reasons as to why the reaction was slower at first is that there were fewer collisions or the collisions were slower. Either of these could be explain by there not being very many particles. The reason as to why there would not as many particles could differ. There was more water than Solution B in some experiments; this would have meant that the water molecules would have got in the way of the Solution B particles colliding and creating reactions. Then when solution B is increased there are not as many water molecules to get in the way of collisions.
The particle diagram below shows my thoughts here:
If I were to predict where the graph would go next I would say that it is going to reach a maximum point at which it cannot go beyond, it is unable to accede where it reaches when it reaches the maximum point. I predict this because once a Solution A particle is completely surrounded by solution B particles it is unable to alter anymore. The diagram below explains this:
Once it is surrounded it does not matter how much Solution B’s concentration is increased it cannot affect the fact Solution A is surrounded.
Although my prediction is supported by my results I cannot say that my prediction was right. All my results suggest that if you double the concentration then you double the rate of reaction and that is what I set out to do support my prediction. And although I have done this I can not say my prediction is right. I have not a carried out the right investigation to say whether or not my prediction is correct. I would need to use a more reliable experiment to say that my prediction was right. I have however gathered more supporting evidence to suggest that my prediction was correct. I have proved that if you double the concentration than you double the rate of reaction.
Evaluation: