One obstacle to the free flow of electrons is the lattice of the atomic nuclei that make up the metal. Another factor is impurities in the metal, which have a higher resistance than the pure metal. If you double the length of the wire you have twice as many of these obstacles to overcome.
Steps to Ensure Accuracy
Things we can use to ensure the accuracy of the results of the experiment are:
- Accurate multi-meters so that you get accurate results and not too many anomalies
- Accurate metre rule so that you get accurate lengths of wire
- Appropriate power source such as a power pack to get the right voltage
I plan to take 15 sets of results for each trial over a range of 15 – 75cm at 15 cm gaps. I will need to repeat the experiment three times which means I will get 30 readings. I will do this to make a fair test and to make it more accurate I will take the average of the results to get a single answer.
With regards to scientific knowledge I already know that that Volts = Current x Resistance (V = I x R)
I know how to measure Current and Voltage with a digital meter and how to measure length with a metre rule.
Prediction
I predict that, the longer the wire is, the more resistance there will be due to the collisions between the electrons and nuclei. In theory, if the length of wire is doubled, then will the resistance will double as well. Because the number of atoms is doubled, it will cause there to be twice as many collisions. I think that I would find out that the longer length of wire the more resistance there would be because the more wire means more particles for the electrons to collide with. I think that there will be a pattern between voltage and amps (current) because as the voltage increases so does the amps. In theory the resistance in the circuit at zero length should be zero, but the connecting wires and the internal resistance of the power pack means that this is not the case.
Equipment
The equipment that I will need is:
- Nichrome wire
- A metre ruler
- Crocodile clips (2 of)
- Connecting wires
- Power pack set on 2 volts
- Digital voltmeter
-
Digital ammeter
To calculate the resistance of the wire I used this formula: Resistance = Voltage/Current (R = V / I)
Safety Precautions
The precautions that I will take are:
- I will keep all electrical appliances away from water - this includes the length of nichrome wire.
- I will keep the voltage at the correct voltage because if the nichrome wire becomes too hot it could burn someone; start a fire on the wood it is mounted on or the thin wire could break in the heat.
- I will need to check that the power supply’s overload switch works in case there is too much current flowing through the wire, which would cause the wire to get hot. This increases the fire risk and the chance somebody could burn himself or herself.
- A Carbon Dioxide Fire Extinguisher was in the lab in case of fire.
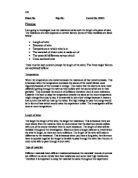
Procedure
To carry out this experiment you would need to follow the procedure below:
- Ensure that all equipment is together on your workbench ready to set up and if not go and collect what is missing from the teacher or the trolley.
- To carry out the experiment correctly you must assemble the apparatus in the right order. Note that if either of the meters are connected backwards then your results will be negative.
- Plug your power pack in to the mains socket on your desk or the wall; when this is done you can start connecting the components together using crocodile clips and connecting leads for the power pack.
- Connect the lead from the power pack to the nichrome wire by using a crocodile clip. Do the same thing on the other side but connect a digital ammeter in between the connections.
- To measure voltage you need a digital voltmeter.
Power Pack
Ammeter
Meter ruler
Connecting wires
Length of nichrome wire
Voltmeter
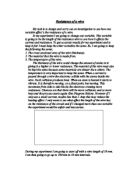
The following table is an example of what I used to record my results in during the experiment. The last column was used to record the resistance in ohms which I calculated after the experiment using Ohms law, (V = I x R)
Results
The results from each of the three experiments are written in the tables below.
Experiment #1
Experiment #2
Experiment #3
Results Summary
Analysis of Results
Review of Results
Using the results obtained on the last page, I drew three graphs on graph paper. These are included at the end of this report. For each graph, I noticed that the points roughly formed a straight line so I drew the straight line on the graph. This is called the Line of Best Fit.
I then worked out the gradient of each of the Lines of Best Fit. These are the gradients that I have taken from my hand-written graphs:
To get a single answer for the experiment, I calculated the average of these gradients:
Average result = 0.0923+0.0962+0.0982 = 0.0956 ohms/cm
3
Expressing this in ohms/metre, the average result is:
To help check this result, I entered the results of the experiment into an Excel spreadsheet. This allowed me to plot graphs of the data and to get Excel to work out the gradients of the Line of Best Fit. The graphs are on the next page.
The gradients on the three graphs came out the same. The number was slightly higher than the figure worked out from the hand-written graphs. The answer from Excel is 0.0969 ohms/cm. Written in ohms/metre this is:
I drew one more graph in Excel by putting all the results on one graph. This is on the page after the three Excel graphs of the individual experiments. This graph shows that the difference between the three sets of results was small as the three Lines of Best Fit are nearly on top of each other.
Analysis Using Microsoft Excel
Conclusions
I have found that my prediction was correct. I had predicted that the longer the wire is, the more resistance there will be due to more collisions between the electrons and nuclei. You can see this from the graphs and tables that it is proven. The Line of Best Fit is a straight line, which shows that the resistance of the wire is proportional to the length of wire.
The resistance of the wire is dependent on the number of collisions between the electrons and the nuclei. Having a large number of atoms will cause a large number of collisions, which will then increase the resistance of the wire.
Therefore if the wire increases or decreases in length, so the resistance will increase or decrease.
Evaluation
Comments on the Procedure
This experiment was successful and I believe it was a sensible procedure as the results were accurate. This is because the Line of Best Fit was a straight line and shows that if the length of wire is increased then the resistance of the wire will also increase.
Variations from Expected Results
Some of the points on my graphs, computerised and hand drawn did not fall exactly on the trend line because of equipment accuracy and the temperature of the wire these and other factors have caused these anomalies. The graphs that I did using excel are most likely to be the most accurate.
Ways of Improving the Procedure
Improvements
- Also to improve the procedure you could check the voltage and current at more points so that measurement errors and other errors of that sort would be averaged out
- Also if the wire is too tight then it might stretch and alter the results. If the wire is too loose, then it may not be properly straight and then your length measurement isn’t as accurate as you want. If we could think of a way of ensuring the wire remains under a constant tension this could improve the experiment.
- I was asked to produce hand-written graphs, but graphs and gradients from Excel were most likely more accurate than the ones that I had drawn because there is chance for human error but the ones in excel are more accurate and there is less chance of mistake on the computer.
Review of Conclusions
Yes the results I got do support my conclusion and my prediction. My graphs show that the longer the wire is, the more resistance there will be. The resistance of the wire is dependent on the number of collisions between the electrons and the atoms. Having more atoms in a row will cause a large number of collisions, which will then increase the resistance of the wire.
Therefore there will a direct proportion between the length and the resistance if the wire increases or decreases in length, so will its resistance.
Suggestions for Further Experiments
- A further experiment that could be carried out is changing the width of the wire instead of the length of it.
- Another way of doing this is by using different widths of wire; for example thin, medium, or thick nichrome could be used to show how the resistance is proportional to each other to the width as it is to the length.
- And I could use the same length and width of many different materials of wire, using the same amount of voltage each time. To show that resistance and length or width are proportional to each other in all metals
- A further experiment that could be done is trying different widths together with different voltages. Using different types of wire would have allowed me to compare the resistance difference between wires would also make an improvement.
Bibliography
The following sources of information were consulted:
Internet Links