Resistance is defined as R=V/I. This means for any given voltage we get a reduced current as the resistive effect against the flow gets bigger. The factors that effect resistance are:
*Type of material
*Temperature of the wire
*Length of the wire
*Thickness of a wire
In this experiment I will be investigating the last thing, the thickness of the wire.
Equipment:
Ammeter,
Voltmeter,
5 different thickness of wire,
10V Power supply,
Variable resistor,
Connecting leads,
To prevent any accidents we are using only low voltages and keeping the current low so that the wires will not become too hot.
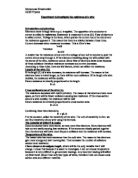
Fair Test: I will be investigating what effect changing the thickness of the wire has on its electrical resistance.
Method: I used the blocks with the wires provided to set up a circuit. Each block has two wires so you can get an average meaning you can improve your results. Adjust the ammeter to get current reading of less than 0.3 amps (so as the heat will not get to intense). Measure the voltage on the first wire and work out the resistance. Do the same for the second wire remembering to adjust the ammeter to 0.3 amps, and then repeat for 5 different thickness of wire. Note your results in a table.
Results:
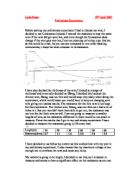
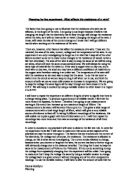
Conclusion: I have noticed that in my 1st graph showing the value of R against A, that with an increase in the area of the wire the resistance would decrease. I came to this conclusion because of this curve I found below.
This shows that there would be a lower resistance if the area of the wire were larger. I then went on to look at my more accurate 2nd graph showing R against 1/A. This showed me if you had a larger value of 1/A there would be a higher value resistance. This is because when a lower area is divided by 1 there would be a higher value of 1/A which has a higher resistance. But when there is a higher area there would be a lower 1/A value, which has been divided by 1,showing a lower resistance, which is shown in my graph.
I saw this steady increase of resistance against the steady decline of the area, both making a straight diagonal line of best fit. This graph supports my prediction.
Evaluation: I think that we carried out this experiment in the best possible way we could due to lack of resources and time. Still we could have done these things below to make the results more accurate.
- I could use a wider variation of wire lengths.
- I could use a wider variation of wire areas.
- I could have made the currents all the same.
- I could have investigated using different materials for the wire.
By Robert O'Sullivan