The results table which I shall record my results on shall look like this;
When I have my results table complete with my valid results, I shall then produce a graph which shows the trend of my results. I will be aiming to get quantitative results.
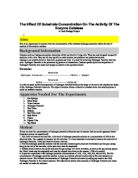
The oxygen given off in this experiment when the catalase reacts with the hydrogen peroxide will be collected in a measuring cylinder (as shown in diagram to the right by bubbling the oxygen through water. To reduce the volume of oxygen lost, an Thistle funnel attached to a conical flask will be used. This ensures that you don't have to take the bung out of the conical flask to inject in the H2O2.
Independent Variable
As I have chosen to investigate the Hydrogen Peroxide concentration, this will be my independent variable.Five different concentrations of hydrogen peroxide will be used as the only variable that will be changed, to see how it affects the rate of reaction. To make the different concentrations water and hydrogen peroxide should be mixed together in different ratios.
In every experiment there must be certain variables controlled so that the experiment does not have deficient flaws in it, that is why I have included all the variable’s that I know of and that should be controlled;
Planning (Method)
1)First of all, the apparatus will need to be set up; I will fill the water tub with water halfway, then I will fill the measuring cylinder all the way to the top,100ml,then turning it upside down while in the water tub, the measuring cylinder will be supported by the stand & clamp.
2)Now that the measuring cylinder & water tube set up, I can thereafter set up the conical flask & thistle funnel. I will take the thistle funnel and fit it onto the conical flask, after that I will connect the rubber tubing from the side arm of the thistle funnel to the measuring cylinder in the water tub.
3)At this moment in time, all that is needed is the celery extract and the hydrogen peroxide solution. As there are five different concentrations of hydrogen peroxide(20%,40%,60%,80% & 100%), I will also need five 10ml samples of liquidised celery. I will get my 250ml beaker which contains 50ml celery extract and one of the test tube racks with five empty test tubes, then I will transfer five 10ml samples of the celery extract, using the 10ml syringe, to five empty test tubes.
4)After that, I will get the bottle with 30ml hydrogen peroxide solution which will be stored in the fridge, as hydrogen peroxide can decompose if left out too long .I will then get the second test tube rack with five empty test tubes and transfer, using a 10ml syringe, 2 ml of H2O2 to the first test tube,4ml of H2O2 to the second test tube, 6ml of H2O2 to the third test tube,8ml of H2O2 to the fourth test tube and 10ml of H2O2 to the final test tube .
5)As you can notice, I will not put the same amount of hydrogen peroxide solution in all five test tubes because I will need to make different concentrations of hydrogen peroxide, therefore I will add distilled water to each of the four test tubes to make up the total solution to 10 ml. I will only add water to four of the test tubes as the fifth test tube which contains 10ml hydrogen peroxide solution will not need any water. With a 10ml syringe; I will have to add, 8ml water to the test tube containing 2ml of H2O2,6ml water to the test tube containing 4ml of H2O2,4ml of water to the test tube containing 6ml of H2O2 & finally 2ml of water to the test tube containing 8ml of H2O2.
6)Now that the hydrogen peroxide solution has been mixed with different ratios to water, the different concentrations are ready to be used with the celery extract. As I mentioned before, i will use 10ml of celery extract & 10 ml of hydrogen peroxide & water solution for each reaction, there will be five reactions as there are five different concentrations (20&,40%,60%,80% & 100%).
7)The 10ml celery extract will be add straight into the conical flask by removing the thistle funnel and then putting it back on. When the celery extract is in the conical flask, I will add the hydrogen peroxide solution into the thistle funnel, with the tap closed so I can let the hydrogen peroxide solution come into contact with the celery extract in the conical flask when I am ready.
8) Whit the stop watch at zero, I will start timing as soon as the thistle funnel tap is open and the hydrogen peroxide solution absconds into the conical flask and starts to react with the celery extract. I will measure how much water is displaced, from reading the volume of the measuring cylinder in the water, at each of the intervals; 30 seconds, 60 seconds, 90 seconds and 120 seconds.
9)I will record the volume of water displaced for each time interval on my results table.
I will repeat steps 7-9 for each hydrogen peroxide concentration.
Discussion and Drawing Conclusion
In this experiment, I believe that I have collected enough data to support my planning and my results graph supports the graph introduced in the "plan" section. This investigation was, I think, successful. Successful meaning my results correspond my hypothesis. I predicted, "as the substrate concentration increases, the rate of reaction will increase at a directionally proportional rate until the hydrogen peroxide is all converted into water and oxygen and the rate of reaction starts to slightly slow down".
The reaction was at its fastest, when the concentration of the hydrogen peroxide was at 100%. Here there were the largest number of substrate molecules to react with the enzymes; therefore there was a greater volume of oxygen and water produced. The results of the experiment clearly show that as the H202 concentration increases, the amount of oxygen produced increases and the conclusion shows that this experiment is valid enough to support the hypothesis stated.
The first graph (showing all the results collected) shows the how much oxygen is produced from different H202 concentrations over 2 minutes. The curves produced for each concentration are similar; they start to curve towards the right. This shows that the reaction starts fast and then slowly slows down as time progresses. This is the case with most chemical reactions and it is expected that if the experiment were continued for a grater time, the graph would show a flat line and the reaction would slow down (gradient decrease), as the amount of H202 to be broken down will have become very small.
Evaluation and improvements
For accuracy I tried to be as accurate as possible, the results of the experiment clearly show that as the H202 concentration increases, the amount of oxygen produced increases; this can be noticed by Graph 2. However, there were some things that couldn't be controlled e.g. natural surroundings, such as temperature of room. Although, the results might not have been as accurate as they could have been when timing. When I used the stop watch, which relied on my reaction, to stop the clock; there could have been a slight glitch; I could have stopped the watch earlier or quicker. Everyone's reaction times are different so it is not particularly the most accurate means of timing. Also, I would have to decide where I would start timing. Would I start timing as soon as the hydrogen peroxide comes into contact with the conical flask or when it has all entered? This raised another problem with my method. This could make the results slightly inaccurate, as if I was timing from when it hit the surface, the speed that it drops may differ slightly, if I was to start timing after all the hydrogen peroxide had entered, then that would slightly fluctuate the results as the reaction has already begun. I tried to keep all the variables except for the concentration of Hydrogen Peroxide the same for all the experiments. However, in reality it is impossible to keep all the variables precisely the same. For example: There is a slight delay when pouring the Hydrogen