What Factors Could You Investigate?
I shall now discuss the viability of investigating these factors. I only have to choose one factor to investigate however.
-
Thickness/Diameter/Cross-sectional area
This is a factor that is possible to investigate, because it will give me a line graph to allow me to predict for future experiments and therefore I can prove a prediction if I investigated this factor, however, there is an awful lot of complex maths involved which would be time-consuming to have to do for every single possible area, and would not be as viable as other factors to investigate
-
Materials
This is a factor that would not be a good idea to investigate. If I investigated this factor, it would not be possible to get an overall, general line graph, because various materials will have been investigated, all with their own properties. Therefore, I cannot predict or prove anything for this factor.
-
Temperature
This is a factor that again, would not be a good idea to investigate. This factor is one that is impossible to investigate, because it is not possible to find out the internal temperature of a wire. Therefore, I cannot investigate it.
-
Length
This is a very viable factor to investigate. It will give me a line graph which I can use to predict future experiments outcomes, and therefore I can prove a prediction. This is the most viable factor to investigate in my opinion.
Based on what I have said about the possibility of investigating those factors, I feel it would be better to investigate the length of a wire resistor. I think the effect that it would have on the resistance would be that as you increase the length, the resistance will be higher. This prediction is based on what I know about resistors and when you increase the length of a resistor, you will increase the resistance of a wire, but I shall attempt to prove in a scientific way that this is correct.
Preliminary Work
The Purpose Of Preliminary Work
The purpose of preliminary work is to decide what is the best way to go about carrying out the investigation. You need to decide various key points. These points include things such as what materials to use, what diameter and lengths to use within your main experiment.
It is important to remember that you are looking for a clear set of results; therefore you want to use the preliminary work to create an experiment that allows you to get the best spread of data results. You need to choose a wire that produces a large change in resistance when you change a setting within the experiment and therefore you can easily spot any errors and ominous results.
Method
The experiment that we will do will enable us to determine which type of wire and what size of wire to use (using the SWG ratings).
We used one piece of equipment for this part of the experiment, the multimeter. In this experiment it was used as an ohmmeter, and was set to measure the resistance of the wires we were testing.
This is the multimeter:
- First, we collected our equipment. For this experiment we needed the multimeter, and a length of wire about 100cm to which we can perform the experiments on. We then plugged some wires with crocodile clips on the end into two of the sockets on the multimeter. We put them into the Ω socket and the COM (or common) socket. And then we turned the dial to measure at 200 within the Ω part of the ring of settings.
- We then used the multimeter and attached the crocodile clips to three different lengths on each type of wire and took a reading. The lengths were 20cm, 50cm and 100cm. We recorded these results into a table (detailed below). The three lengths were taken on the Copper, Nichrome and Constantan.
- We then packed the equipment away. That is the end of the experiment.
Results
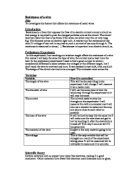
These are the results of our preliminary experiment. The column headed SWG rating needs to be explained. SWG means Standard Wire Gauge. This is a measurement of what diameter the wire is. The lower the SWG, the thinner the piece of wire; the higher the SWG, the thicker the piece of wire. Various SWG ratings have been used. However, it is possible to gain an idea of what kind of results other SWG ratings would be giving.
The results above have enabled me to gain an idea of what wire to use. Copper is definitely not a good idea, mainly because it does not give a wide enough spread of results. Nichrome is a possibility, because it gives a good spread of results, but may be a good idea to try with a higher SWG rating. Constantan gives a good spread, however, it has a high SWG rating, but a spread of results that is not that much better than Nichrome 24. Therefore, I shall repeat the experiment, but with Nichrome and a higher SWG rating. I shall use Nichrome 36.
It is clear from these results that there is a good spread here. The SWG rating is not really any higher than the Constantan but gives a much better spread of results. Therefore, I shall use Nichrome 36 within my main experiment.
Main Investigation
Purpose Of Work
The purpose of this work is to investigate how lengths affect resistance.
List Of Equipment
The Equipment that I shall use for this experiment will be:
- Power pack (set at 3 Volts)
- 6 Leads
- Ammeter
- Voltmeter
- 2 Crocodile Clips
- 100cm length of Nichrome 36 wire
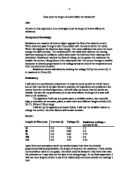
Circuit Diagram
Key
Wire
Ammeter
Voltmeter
Variable Resistor
Method
This method has to be fair, for that reason, the experiment will be carried out three separate times, each time the settings of each device will remain the same and the entire experiment will be carried out within one lesson to ensure that between the change in day, errors cannot be made in terms of changing a vital settings, such as a change in volt settings on the power pack. The material (Nichrome) will be used in each experiment and that will be checked before the start of the experiment. We will also be using a wire with SWG rating 36, this shall also be checked before the start of the experiment. The variable resistor also needs to have the same setting each time. We shall ensure that the variable resistor is not at all touched and therefore the setting on that shall remain the same at all times.
- Firstly, assemble the equipment. Gather up the required equipment using the list above and use the circuit diagram above to correctly put it together. The ammeter is actually put in series with the rest of the circuit, whereas the voltmeter is put in parallel at the appropriate section. Simply put the wires coming off from the voltmeter into the slots on the wires with the crocodile clips on that you attach to the wire. Set the Variable resistor to any setting, but not too high. For the variable resistor, one wire needs to go into one of the two sockets on one end, and then another wire needs to come out at the other end in the only socket that a wire can be put into.
- Put the Nichrome wire in-between the crocodile clips. The wire must be put at the appropriate lengths (10cm, 20cm, 30cm, 40cm, 50cm, 60cm, 70cm, 80cm, 90cm and 100cm). One crocodile clips is fixed, the other can be unclipped and put at the fore mentioned intervals.
- When you turn on the power pack which should be set at 3 Volts, and have ensured the Nichrome wire is at the length interval you require, take the reading from the voltmeter and the ammeter. Ensure that these results are correct.
- Repeat step 3 for each interval. Then repeat the entire experiment throughout and take readings and record the results once again and make sure the variable resistor is at the same setting and that the power pack has the same number of volts (3 Volts)
Results
Nichrome 36
Results from the experiment the first time around:
Results from the experiment the second time around:
Results from the experiment the third time around:
Results
Table of Averages
This is the results table using my averages for the resistance and it has a line of best fit on it. This is a positive correlation.
Evaluation
Quality Of Data
I would say that the quality of my data was fairly consistent and accurate. The variations between data between experiments was minimal, and seemed to stay in line with what was expected. For this reason, I doubt that there were that many errors in my experimental procedures or my data collection.
Quality Of Graph
There were no ominous results on my graph. This is both a good and bad thing. This is good, because it shows how good my procedures and testing methods are, but it is bad because it makes me suspicious as to whether my experiment was that perfect. I would expect an ominous result, or at least more results that went away from the line of best fit. They seem to fit an obvious pattern, and therefore make it harder to improve upon.
Fairness Of Testing Conditions
I believe that my test conditions were fair, and that all stages were checked thoroughly. The lengths were checked regularly to ensure they were correct, and the materials were checked too. The settings of the variable resistor and the power pack were never altered. Therefore, I believe that my test conditions were as fair as I could make them in the classroom environment.
Mini Plan Further Experiments
If I was going to do this experiment again, then I would allow more time to be allotted to carry out the experiment and to be able to ensure that all fair test methods were more strictly adhered to. I would also carry out more experiments at more intervals, and do for instance 5cm, 10cm, 15cm etc. Those are the only improvements I feel can be made.
Conclusion
In conclusion, I feel that I have proved my prediction that as the length increases the resistance also increases. I feel the experiment was performed well and gave me satisfactory results.