The pH and temperature of which an enzyme works is called its optimum.
If the temperature increases it will increase the rate of which the enzyme works therefore increasing the rate of reaction. If the temperature decreases it will slow down the rate of which the enzyme works therefore decreasing the rate of reaction. This is because if you increase the temperature the molecules will move quickly with greater energy causing more collisions and therefore increasing the rate of reaction.
Most changes in the pH of an enzyme are reversible. An enzyme that was working at a low pH will resume its normal activity once it starts at its optimum activity again. However if there is a very high pH then the enzyme may become irreversible.
If the amount/ volume of an enzyme is high then it will increase the rate of reaction. This is because if there is a greater surface area of an enzyme then there are more molecules exposed and available for collisions. This will increase the amount of collisions therefore increasing the rate of reaction.
If there is a high concentration/amount/volume of the substrate the rate of reaction will increase. This is because if there is a greater concentration in the same area then there will be a greater amount of molecules resulting in more collisions. This will increase the rate of reaction.
Variables
Input variable – Concentration of enzyme, the amount of food; liver,
potato, pea.
Output variable – Volume of gas produced in cylinder. The rate of how
much oxygen is produced.
Controlled variables
- Temperature – to control this variable I will keep a water bath at
room temperature which is 23°C.
- pH – to control the pH of the solution I will keep the concentration
the same throughout the experiment. A buffer of pH7 was
added to the H2O2 solution to keep the pH the same.
-
Volume of H2O2 – to control this variable I will use a measuring
cylinder to measure out 20cm3 of H2O2
solution.
-
Concentration of H2O2 – to keep this variable constant I will keep
the concentration the same throughout
the experiment. The concentration is 1.8
mol/dm3.
Prediction
If the surface area of the food doubles, then I will expect the rate of reaction to double. So if I used a surface area of 2cm2 I would expect to produce 10cm3 rather than 5cm3 if I was using a surface area of 1cm2.
This is because if you double the amount of molecules in a certain area then there will be twice as many collisions therefore the rate of reaction will increase. This is the shape I predict my final graph to look like.
Preliminary work
To determine what apparatus and food I should use I carried out various experiments.
I tried two different methods of measuring the rate of oxygen production. One method was to use a boiling tube, delivery tube and a gas burette, and measure the amount of gas produced in the gas burette.
Another method I did was to count the bubbles that were produced from the reaction between the food and the Hydrogen Peroxide.
I also decided to use the gas burette with the more accurate readings on it. This is to make my results accurate.
I used 20cm3 of Hydrogen Peroxide, as this seems a reasonable amount to use.
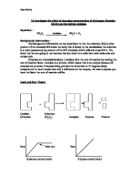
I then tried three different foods:
-
Liver – this produced more than 19cm3 of oxygen in less than 10 seconds.
- Pea -
3. Potato -
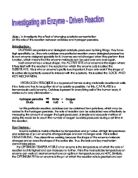
Main Experiment Method
I have decided to use the method, which includes the apparatus: boiling tube, delivery tube and a gas burette. This is because they are the most sensible and more accurate set of apparatus compared to the method of counting the bubbles that were produced. It was very inaccurate because the bubbles were produced to fast in some cases.
I will use the potato as the pea was too slow and the liver was too fast too take accurate readings. I will use 1cm lengths of potato to increase the surface area and increase the number each time. I will use 20cm3 of Hydrogen Peroxide. I will take 7 readings at intervals of 30 seconds, this gives enough time to read the result and for the reaction to take place. I will take two repeats of each number of 1cm potatoes; this will make sure I will have some reliable readings. I will be measuring the amount of oxygen produced. 1 will take all the cylinders of potato from the same potato, as all potatoes are different in concentration and enzymes etc. so I kept mine the same.
Method
- Prepare a water bath for the test tube that will contain the Hydrogen Peroxide and one for where the gas will be collected via the delivery tube.
-
Measure out 20cm3 of Hydrogen Peroxide and pour it into the test tube.
- Fill up the gas burette with water and then place in the second water bath without letting gas into the burette.
- Measure 1cm of potato and then place into the test tube, and then place the bung over the test tube.
- Wait until the first bubble appears from the delivery tube into the gas burette then start the stopwatch.
- Time for three minutes recording the volume of gas produced every 30 seconds.
- Rinse out the test tube and repeat steps 2 – 6 increasing the number of potatoes in step 4 until you have used at least 5 different surface areas.
I will wear safety goggles throughout the experiment, as the Hydrogen Peroxide is corrosive. The potato is a biological hazard as it is an organism so I will wash my hands after the experiment. I should also be careful, as I will be using glass apparatus, not to break any or to cut myself.
Results Tables
Results for the surface area of 4.10cm2.
Temperature - 24°C.
Results for the surface area of 8.11cm2.
Temperature - 24°C
Results for the surface area of 12.21cm2
Temperature - 24°C
Results for the surface area of 16.31cm2
Temperature - 24°C
Results for the surface area of 20.41cm2
Temperature - 24°C
Results for the surface area of 24.51cm2
Temperature - 24°C
For this particular experiment I wasn’t happy with my second set so I decided to take another set. I will ignore the incorrect set when I come to work out the average rates.
Average rates
For surface area 4.10cm2 the average rate =
0.36 + 0.39 + 0.42
3
= 0.39 cm/s
For surface area 8.11cm2 the average rate =
1.00 + 1.20 + 1.50
3
= 1.23 cm/s
For surface area 12.21cm2 the average rate =
1.80 +1.90 + 2.40
3
= 2.03 cm/s
For the surface area 16.31cm2 the average rate =
2.05 + 2.15 + 2.30
3
= 2.17 cm/s
For the surface area 20.41cm2 the average rate =
3.70 + 4.00 + 4.20
3
=3.97 cm/s
For the surface area 24.51cm2 the average rate =
4.80 + 5.00 + 5.20
4
= 5.00 cm/s
Analysis and Conclusion
From my graph of the average rate against surface area, I can see that it is directly proportional. On my predicted graph I drew a line that finished with a curve. On my actual graph all my graphs have a best-fit line. For the graph of surface area against the average rate, the best-fit line does not pass through the origin. On my predicted graph I predicted that the line would pass through the origin. As I can see this does not happen. This is because if I made my line pass through the origin then it would not be best fit. So I have drawn it as close as I could.
From my first set of graphs I can see that as the surface area of the potato increases the volume of oxygen also increases. I can see this on my final graph more clearly as it shows the rate of reaction against surface area. When the surface area is 5cm2 the average rate is 0.45cm/s. When the surface area is 10cm2 the average rate is 1.6cm/s. This shows the rate of reaction of the potatoes does increase with the surface area.
This is because of the collision theory. If there is a larger surface area the molecules are more exposed and so there are more available to react.
Evaluation
I feel that my experiment went well. I don’t think that there were any major problems with my method.
I have one anomalous result, which I have circled on my graph. This could have been caused by
I feel my results are quite accurate. However the error bars are fairly big. It is reasonably close to the best-fit line, although it does not follow the same line. The best-fit line is steeper than the predicted line. To work out how accurate my results are I can work out the % error and % accuracy:-
% Error = Difference in rates x 100
Average rate
% Accuracy = 100- the % error
Errors within my experiment
The potato pieces were sticking together which results in a lower surface area. I could not be exact in cutting the potato pieces exactly the same size every time. Also I had to do the experiment over a period of two days. The first day I did the experiment the temperature was hotter than the second day. So on the first day the reaction would have been quicker due to the collision theory.
Improvements that could be made
To reduce the risk of the potato pieces sticking together I could have used a larger boiling tube. This would have meant that the potato pieces were further away from each other. To make sure they were equal sizes I could have used a cutter that was set to 1cm. To keep the temperature the same I could allow a longer time to do my experiment in, so I would finish it on the same day that I started it.