How it is measured?
The resistance of a length of wire is calculated by measuring the current present in the circuit (in series) and the voltage across the wire (in parallel). These measurements are then applied to this formula:
V = I*R where V = Voltage, I = Current and R = Resistance
This can be rearranged to: R= V/I
Apparatus
The following equipment was used to carry out the experiment:
- Ammeter was used to measure current passing through the wire
- Digital Voltmeter was used to measure the potential difference across the wire
- Length Nichrome Wire
- Power Supply
- Metre Ruler
- Four connection leads
- Two crocodile clips
Diagram
Fig. 1.1 shows my circuit diagram, could measure the resistance of a piece of Nichrome wire.
Fig. 1.1 Circuit Diagram
Method
Setup:
My circuit was setup as shown in Fig. 1.1 to produce accurate results, the ammeter is in series so all of the amps, have to travel through the ammeter. The voltmeter is parallel with the wire because the volts are equal across the circuit when in parallel.
Connection:
- One metre length of Nichrome wire was stretched across a one metre ruler.
- Connect the first connection lead’s end to one end of battery power supply’s socket (+), and the other end to the end of the ammeter’s socket (+).
- Connect the second connection lead’s end to one end of battery power supply’s socket (-), and the other end to the end of the voltmeter’s socket (-).
- The first crocodile clip is clipped to the wire at the 0cm position on the metre ruler.
- The second crocodile clip is clipped to the relevant position, depending on the required length if the wire.
Procedure
- The power supply is turned on.
- The voltage and current is the read of the ammeter and voltmeter.
- Then recorded and tabularized.
- The power supply is then turned off.
- The second crocodile clip is moved to the next position.
The above steps were completed for each length (10, 20,40,60,80 and 100cm) and then the entire experiment is repeated for accuracy, this was done for both test A and B as shown in my results table
Safety Precautions
There are not many safety precautions that need to be taken into consideration, in this experiment. The main three I can think of are stated below:
- Do not carry out the experiment in wet areas, as water is a very good conductor, and thus could be very dangerous.
- Make sure the wire is not connected for long periods of time. This makes the wire hot and destroys equipment.
- Disconnect the wires should the ammeter reading go too high.
Results Table
The table below shows two test results (result A result B) for the different lengths of wire tested on the voltage and current. The two voltages were added up and then divided by two, to give the average voltage. The same method was produced to receive the average current. Then the average voltage was divided by the average current to get the resistance. (the resistance was calculated using Ohm’s Law R= V/I)
Table 1.1 Results
Conclusion
Having conducted this experiment the following conclusion was drawn:
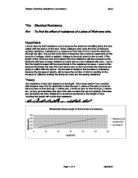
I found out that the length of wire affects the resistance of a wire because the number of atoms in a wire increases or decreases as the length of a wire increase or decreases in proportion. The resistance of a wire depends on the number of collisions the electrons have with the atoms in the wire, if there is a larger number of atoms there will be a larger number of collisions that will increase the resistance of a wire. If the wire was half the length, it would have half the number of atoms, this means that the electrons collide with the atoms half the amount of times. In addition, if the length of a wire was trebled or quadrupled, the resistance would also treble or quadrupled. My graph shows that the resistance of the wire is proportional to the length of the wire. I know this because the line of best fit was a straight line through the origin showing if the length of a wire is increased the resistance will also increase. In my graph I notice one odd point; I think this odd point may have occurred because at some point a result was recorded inaccurately. From my results I have shown that my prediction was correct, as the line of best fit is a straight line proving that the resistance of a wire is proportional to the length of a wire. Further research shows that measuring the resistance of the length of a wire is the easiest factor compared to the other factors. I.E. material, thickness, temperature.
Evaluation
In the conclusion I have mentions and the graph I have shown one odd point, this means that there must have been an error in experiment. As the wire length, is bigger at this point I found it difficult to stretch it out and consequently measure it accurately. Although the graph is overall accurate and the results precise, it is to see the odd point’s average plotted because the odd point does not lie along the line of best fit. The graph shows that my results are reliable as there is only one odd point, (which can easily be accounted for); however, there are certain improvements I could make to improve the accuracy, namely:
- Ruler selotaped to the table, to make easier and precise as I will not have to keep on holding the wire then putting the crocodile clips on.
- Use pointers instead of crocodile clips. The pointers would be more accurate because the tips have a much smaller area than the crocodile clips giving a more accurate measurement of the length of a wire.
- Letting the wire cool down sufficiently in between readings. When the wire heats up, it has a lot of energy, which causes the atoms in the wire to vibrate, making it difficult for electrons to travel. This increases the resistance via another method, so it is not truly a fair test.
To improve the reliability of my results I could perform more repeats in doing this my average would be more reliable, but this would be to time consuming.
Further experiments I could do related to the resistance in a wire, would be to see whether the following factors would make difference that is:
Temperature:
The resistance of a wire will increase as its temperature increases. A small increase in temperature may not give a noticeable change in resistance but the more the temperature rises, the more obvious it becomes that the resistance is also rising. E.g. the thin wire inside a lamp (called the filament) becomes white hot, which causes the lamp to shine. If the wire is heated up the atoms in the wire will start to vibrate because of their increase in energy. This causes more collisions between the electrons and the atoms as the atoms are moving into the path of the electrons. This increase in collisions means that there will be an increase in resistance. However, for the temperature of the wire I would not be able to carry out a fair test because it is extremely difficult to produce and control the range of temperatures needed without the correct equipment.
Material:
The type of material will affect the amount of free electrons which are able to flow through the wire. The number of electrons depends on the amount of electrons in the outer energy shell of the atoms, so if there are more or larger atoms then there must be more electrons available. If the material has a high number of atoms there will be high number of electrons causing a lower resistance because of the increase in the number of electrons. Also if the atoms in the material are closely packed then the electrons will have more frequent collisions and the resistance will increase.
If I chose to measure the difference in the resistance in different materials I would chose a number of different materials and using the same voltage I would record the resistance given by each wire of the same length and width. Although once again it would be simple to record these results the graphs that could be drawn would not show any connection between the material and the resistance because of the limited number of materials I could test with the equipment available.
Wire width:
If the wires width is increased the resistance will decrease. This is because of the increase in the space for the electrons to travel through. Due to this increased space between the atoms there should be less collisions. If I were to choose this factor to measure the wire width I would use different widths of the same length and same material of wire e.g. thin, medium and thick copper wire with thin and thick constantan wire. To record the difference in widths I would use the same voltage and measure the resistance for each thickness. Although it would be easy to obtain and record the data the graphs that I would be able to draw up would not be interesting.