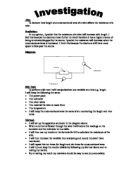
SUBSTANCE
This variable is the type or types of metal of which the wire has been made. Obviously, this is going to be important to influence the absolute resistance of the circuit. This is because different metals have different atomic structures. This means that the atomic arrangements in the wire will be different. Therefore, in some metals, the atoms will be further away from each other simply because they are larger. This allows the electrons to flow through the larger gaps in different metals. This variable is closely related to length and cross-sectional area. Since I will be using fuse wire, I have a limited choice on the substance the wire will be made of. The most common substance used to make fuse wire is nichrome, so I will be using it for my experiment.
TEMPERATURE
This variable originates from the kinetic theory of matter. At any temperature above zero Kelvin in a solid, such as a metallic wire, the atoms are closely packed together, vibrating about a fixed point. If you increase the temperature, the atoms start vibrating over a greater distance and more frequently because they have more energy. This severely reduces the probability of an electron passing through the gaps between the atoms without colliding and losing electrical energy. Similarly, if you reduce the temperature, the vibrations become less, therefore giving the electrons a larger space, and more time to pass through. This reduces energy loss from the electrons. This is wherefrom the idea of superconductors comes from. Since a higher temperature means larger vibrations, I can predict that resistance is directly proportional to temperature.
Fig. 1.5.6.1. Electrons in a cool wire
Fig. 1.5.6.2. Electrons in a hot wire
As you can see above, in the first of the two diagrams, the atoms are not vibrating as much as in the diagram below. Therefore, as the electron flows through the wire, it collides with atoms three times and loses a certain amount of energy. In the second diagram, the same electron with the original energy flows through the same wire. This time though, the atoms are vibrating more, therefore the electron collides with atoms four times, losing more energy than in the first one.
The temperature will be the second control variable in this experiment. As it is only a control variable, I will not alter its value through the course of this experiment. Instead, its value will remain at what is room temperature, about 25˚C. This will enable me to perform a fair experiment in which the temperature is always constant.
Observations to be made:
Now that I have stated what variables will be involved in my experiment, I will list the observations that I have to make a note of during my experiment and how I will go about making these observations.
Given that my main objective in this experiment is to study the relationship between the resistance of a wire and its length and cross-sectional area, it is clear that I will have to observe the resistance since that is the variable that I do not control. As I have already stated, this can be done either be done by plotting a graph and working out the gradient or by using Ohm’s Law, which is R = V/I. To actually record the current and voltage, I will use an ammeter and voltmeter respectively. The ammeter is always connected in series with a circuit and the voltmeter always in parallel. These devices will allow me to record the current and voltage both to two decimal places; hence the readings will be accurate enough to give me a correct value for the resistance.
To actually record the observations I make, I will have to construct a table of some sort that will allow me to record the observations in a clear and organised manner. Although I will be performing two experiments, I can plot them both in just on table since one is just an extension of the other. Therefore, the table should look like the following:
Table 1.6.1. Sample results table
As you can see, for each length and cross-sectional area, there are five columns. The first two columns are there to record the current and voltage from each of the repeats that I perform at each length. The second two columns will record the average current and voltage that I have observed. This can be done simply by adding the three values for current and voltage at each length and then dividing the two sums by three. The fifth column will be the average resistance, which I will work out after plotting the graphs. The table above will of course continue until the length reaches 150 mm. In addition to this, there will be another table that will record the values of current and voltage at each length so that I can plot a graph to work out the resistance. Once the tables are complete, I will use the values for the resistance at each length to plot a graph of resistance against length. I will plot a line of best fit, and using this line, I should be able to establish a complete relationship between the length and the resistance. Of course, I will repeat the graph twice more for the other two cross-sectional areas and using these graphs, I will attempt to link the relationships together, of both length and cross-sectional area.
Theory:
To begin with, we have to define voltage and current since these definitions will be the basis behind our theory. Voltage is the energy given to each coulomb of charge by a battery or the energy taken away from each coulomb by a resistor. Current is the number of coulombs passing by a point every second.
As we have learned, the resistance of a length of wire largely depends on the substance it has been made of. Since some substances allow electrons to flow more easily than others do, we can class different types of wires into two categories – conductors and insulators. A conductor is a wire that allows electricity to pass through it without any loss of energy, i.e. it has low resistance. A resistor is one that restricts the flow of electricity as much as possible by providing a large resistance. Therefore, different substances can be grouped as conductors or insulators. The most common conductors are metals because they have ‘free’ electrons. This allows these electrons to carry the electrical energy so that there is no loss of it from interactions between the electrons and the atoms themselves. The best conductor is silver, closely followed by copper, but copper is more commonly used to the higher price of silver.
Now lets define resistance. Resistance is a property of any object or substance of resisting or opposing the flow of an electrical current. The quantity of resistance in an electric circuit determines the amount of current flowing in the circuit for any given voltage applied to the circuit. This is known as Ohm’s law. This law states that the amount of current passing through a conductor is directly proportional to the voltage across the conductor and inversely proportional to the resistance of the conductor provided that the temperature remains constant. The resistance of a conductor is defined by the following equation:
Where R is the resistance and is measured in ohms, V is the voltage or potential difference and is measured in volts, and I is the current and is measured in amps.
Since the most important variables in this experiment are the length and cross-sectional area, I will now discuss these in further detail.
The resistance of a piece of wire (usually metal) can be regarded as arising from the interactions which occurs between the crystal lattice of the metal and the ‘free’ electrons as they drift through it under an applied voltage. This interaction is mainly due to the collisions between the electrons and the vibrating ions of the metal, but collisions between defects in the crystal lattice such as impurities and dislocations also play a part, especially at low temperatures.
Fig. 1.7.1. Cross section of a wire
As I have stated before, one of the variables involved in this experiment is the length. The longer the wire is, the greater its resistance. If one wire is twice as long as a wire of identical diameter and substance, the longer wire offers twice as much resistance as the shorter one. This is due to the interactions or collisions between the atoms and the electrons in the wire. As the electrons flow through the wire, electrical energy is continuously lost through these collisions. In a relatively short piece of wire, the electrons do not have many collisions with the atoms, and therefore not much energy is lost. As the length of the wire becomes longer, the number of atoms in the wire increases in proportion. Therefore, the number of collisions increases because there is a longer length to pass through. Hence, in a wire, which is twice the original length, there will be twice the number of collisions due to twice the number of atoms, and so twice the amount of energy will be lost. The wire will have twice the resistance. Assuming this is accurate, I can therefore state that the resistance will be directly proportional to the length.
The other variable in this experiment is going to be the cross-sectional area, or thickness. This is the opposite of length because a thick wire offers more room for an electric current to pass through than a thin wire does. A wire whose cross-sectional area is twice that of another wire of equal length and identical substance has only half the resistance of the thinner wire. This is again due to the amount of collisions that take place inside the wire. A wire of certain length and cross-sectional area will have a certain amount of collisions between the atoms and electrons. However, if you increase the cross-sectional area, the number of atoms increases in proportion, but so does the possible number of gaps between the atoms for the electrons to pass through. Therefore, with a thicker wire, the electron have a lower chance of colliding with an atom because there are a larger number of gaps to pass through which have not been taken up by other electrons. This reduces the number of collisions so that in a wire of twice the cross-sectional area but the same length, there will be half the number of possible collisions, and therefore have the amount of energy lost. Therefore, I can confirm that the resistance is inversely proportional to the cross-sectional area.
For the mathematical reason as to why these laws of proportionality are true, we have to go back to Ohm’s law and our definitions of voltage and current. Since resistance is principally the electrons losing their electrical energy, the energy lost by the electrons to a wire can be described as being the voltage across the wire. Given that the power source remains constant, the amount of current passing through any point in a circuit remains constant, but as the length of the wire increases, the voltage increases because there is more energy lost and so the resistance increases due to Ohm’s law. Lets consider some examples. Say the current in a circuit is 5A. A 10mm long wire has a voltage of 10V. The resistance for this wire would work out to be 2Ω. Say if we increase the length of the wire to 20mm, the voltage becomes 20V. The resistance for the longer wire would therefore be equal to 4Ω.
Method:
- The method is definitely the most important part in the experiment because no matter how sound the theory is, the outcome of the experiment will always depend on how clear and detailed the method is. The following method will list all the steps needed to accurately prove or disprove the prediction for the experiment.
- Clear the workspace of all items except those listed in the apparatus. The workspace should be well lit so that you can clearly see the readings on any of the devices.
- Set up the equipment as shown above in the diagram (see Apparatus). Connect the wires and devices together using crocodile clips.
- Make sure that the length of the ‘resistance’ wire is 10 mm exactly. Also, make sure that you are using the wire with the lowest cross-sectional area.
- If you have done this correctly, you should be observing readings on the ammeter and voltmeter.
- Make sure that the sliding contact on the rheostat is as far away as the batteries as possible so that no resistance is created from the rheostat for the moment.
- Now that it is all set up, prepare the piece of paper with the table to note the values.
- Note down the values on both the ammeter and voltmeter into their respective boxes in the table for 10mm.
- Now move the variable resistor a bit towards the battery so that you increase the resistance.
- Repeat steps 7 and 8 four more times with the wire at the same length and cross-sectional area but a new piece. Make sure you finish with step 7.
- Now repeat steps 7, 8, and 9, increasing the length of wire each time by 10mm until you note down the values at 150mm.
- This part of the experiment is over, so choose another wire with a larger cross-sectional area.
- Repeat steps 7 to 9 for this cross-sectional area.
- Repeat step 10, then repeat steps 7 to 9 again.
- The experiment is now over. Make sure that the table is full with the correct values in the correct boxes.
- Plot the graphs and come up with your conclusions.
Prediction:
Since my theories have been based upon research, my predictions will follow those theories. As I have stated in my theories, the collisions between the electrons and atoms depend on the number of atoms, electrons, and the number of space for the electrons to pass through. Therefore, my predictions will be based on these ideas.
LENGTH:
I predict that the resistance will be directly proportional to the length of the wire, i.e. the resistance will increase as the length increases. Since there is no limit to a length of a wire, there would consequently be no limit to the resistance of a wire. Therefore, the graph, once plotted would look like the one below.
Fig. 1.9.1.1. Predicted graph of resistance against length
CROSS-SECTIONAL AREA:
I predict that the resistance will be inversely proportional to the cross-sectional area, i.e. it will decrease as the cross-sectional area decreases. Although this is true, it will not be a proportional decrease because even though there is no limit to how large the cross-sectional area of a wire can be, there will still be collisions between the electrons and atoms, either due to impurities in the wire or due to the fact that there is always a chance of a collision. Therefore, the gradient of the graph will slowly decrease as the cross-sectional area increases.
Fig. 1.9.2.1. Predicted graph of resistance against c.s.a.
Variables table:
This experiment involves several variables, some of which are not noticeable at a glance. However, all of these variables are involved in determining the resistance of the wire. For simplicity, I have decided to list all of these variables in the following table:
Table 1.10.1. Variables table
Preliminary work:
The preliminary work is mainly designed to investigate whether or not the variables and their ranges chosen by me actually show a change in results. To do this, you have to perform the actual experiment using the method stated, but only for the extremes of the variables. This is to test if the variables to change and if there is no change in results for the two extremes, then there obviously cannot be any change in the actual experiment. If there is a change, then it proves that the range or variable chosen by me is correct and that I can go ahead with the full experiment.
For the preliminary for this experiment, I will simple take the lowest thickness of the wire that I will use (0.28 mm) and the highest thickness (0.45 mm) and measure the voltage and resistance at 10 cm and 100 cm for both the thicknesses. This should demonstrate to me if there is indeed a change in the resistance for the thicknesses and the length, and if the change is in accordance to my theory and hypotheses. Of course, I do not have to worry about the accuracy in my hypotheses at this moment since I am only testing to see if there is a change in the variables. The results for my preliminary experiment are listed along with the results for the entire experiment.
OBTAINING EVIDENCE
Preliminary Results:
The following results are all the values for current and voltage that I obtained while doing the preliminary experiment for length and cross-sectional area.
LENGTH:
Table 2.1.1.1. Preliminary table; length 10 cm
Table 2.1.1.2. Preliminary table; length 100 cm
CROSS-SECTIONAL AREA:
Table 2.1.2.1. Preliminary table; c.s.a. 0.25 mm2
Table 2.1.2.2. Preliminary table; c.s.a. 0.06 mm2
Length:
The following tables contain all the data that I collected for the voltages and currents with wires of various lengths at a thickness of 26 swg (0.45 mm). The cross-sectional area of this wire therefore equals π x ½d2 = 0.16 mm2.
Table 2.2.1. Length 10 cm
Table 2.2.2. Length 20 cm
Table 2.2.3. Length 30 cm
Table 2.2.4. Length 40 cm
Table 2.2.5. Length 50 cm
Table 2.2.6. Length 60 cm
Table 2.2.7. Length 70 cm
Table 2.2.8. Length 80 cm
Table 2.2.9. Length 90 cm
Table 2.2.10. Length 100 cm
Cross-sectional area:
The following tables of cross-sectional area contain all the raw data collected for the five different cross-sectional areas. The length is kept generic for all the five wires at 40cm.
Table 2.3.1. C.S.A. 0.25 mm2
Table 2.3.2. C.S.A. 0.16 mm2
Table 2.3.3. C.S.A. 0.11 mm2
Table 2.3.4. C.S.A. 0.08 mm2
Table 2.3.5. C.S.A. 0.06 mm2
ANALYSIS
I have successfully completed obtaining my results using the method stated in my section. Using these results, I will now attempt to plot several graphs and then I will come up with conclusions in line with scientific knowledge. These conclusions should therefore enable me to theorize a general rule of some sort that I can in turn test in an extension experiment.
After drawing all the graphs (except the resistance ones), I have to work out the average gradients (resistance) for each length and cross-sectional area. To facilitate this process, I have constructed two tables, one for length and one for cross-sectional area so that I can enter the resistances of the repeats and then add in the average resistance.
Table 3.1. Final results table of resistances of length
Table 3.2. Final results table of resistance of cross-section area
THEORY/HYPOTHESES:
In my theories for length and cross-sectional area, I stated that as the length of the wire increased, the resistance would increase as well, and as the cross-sectional area increased, the resistance would decrease. This was due to electrons colliding with atoms in the wire and losing energy, causing resistance. Since I have drawn the graphs, I will now analyse them using scientific knowledge to see if the results agree with my theory and hypotheses. Once this is done, I will generate a general formula that can be applied to similar wires so that the results are the same.
LENGTH:
Since I expected the graphs for voltage against current with length as the variable to turn out as directly proportional, I wasn’t surprised with the results. All the graphs for length turned out similar, as all of them were directly proportional. This is called Ohm’s Law. This states the voltage across a wire is directly proportional to the current across it provided the temperature remains constant. Since the temperature did remain constant because I was using a very low voltage supply, the graphs complied with Ohm’s Law.
Once I plotted all the graphs of voltage against current for length, I measured all the gradients of the graphs. This was done using g = y/x. Since in this case it was voltage/current, the gradient worked out to be the resistance of the wire. Now I could plot a final graph of resistance against length. This graph would prove or disprove one of my hypotheses: that the resistance was directly proportional to length. After plotting the graph using the average resistances (see above), the graph turned out to be exactly directly proportional, as I had predicted.
This is related to my theory. I stated in it that as the length of a wire increased, so did the number of atoms in it. Therefore as the electrons carried electrical energy around the wire, they collided with more atoms than for a shorter wire and therefore lost greater amounts of energy. This made it appear that the wire had a higher resistance when it was longer. If the length of the wire is doubled, then the number of atoms in that length of wire is doubled. This therefore doubles the number of collisions between the electrons and atoms, and the electrons lose twice the amount of energy. This results in the wire having twice the resistance.
Fig. 3.2.1. Electrons in a long wire
The same applies to when the length of the wire is halved. If the length is halved, the number of atoms to collide with is halved as well. Since there are fewer atoms, there will be half the number of collisions between the electrons and the atoms, therefore half the energy would be lost than from the original wire. The wire will have half the resistance.
Fig. 3.2.2. Electrons in a short wire
CROSS-SECTIONAL AREA:
I stated in my hypothesis for cross-sectional area that as the cross-sectional area or the ‘thickness’ of the wire increased, the resistance would decrease. This was because as the electrons moved through the wire, they would have a larger space to spread out over since the wire was wider. This would reduce the probability of them colliding with each other and the atoms in the wire and losing electrical energy. The wire would therefore have a smaller resistance. If the cross-sectional area of the wire was doubled, the number of atoms would double, but so would the number of spaces between the atoms for the electrons to pass through. Therefore the electrons would have half the probability of colliding with an atom since there is twice the probability of the electron passing through without a collision. The wire would therefore have half the resistance of the original wire because in the thicker wire, only half of the energy lost in the original wire is lost.
Fig. 3.3.1. Electrons in a thick wire
If the cross-sectional area of the wire is halved, the number of spaces for the electrons to pass through will be halved. Therefore there will be twice the possibility of collisions with atoms and the resistance will double.
Fig. 3.3.2. Electrons in a thin wire
The graphs for voltage against current for cross-sectional area represented exactly what Ohm’s Law stated about the proportionality between voltage and current. Once I plotted all the graphs for V against I, I measured their gradients to obtain the resistances. I then repeated exactly what I did for length and plotted a graph of resistance against cross-sectional area. The graph turned out to be exactly like what I predicted in the hypotheses. It was an inversely proportional graph (downwards curve), which I know because if you take the inverse of the cross-sectional area and plot resistance against it, you get a directly proportional graph. This again proved my theory. This was that even though a wire had no limit to its cross-sectional area, there would always be some collisions between electrons and atoms, due to impurities or probability. The line would therefore never reach zero resistance since there could not be a wire with zero resistance.
Now both my theories and hypotheses have been proven correct by my results, I will attempt to put together a general formula that I can use for any other wire and get similar results.
CONCLUSION:
Since both my graphs have proven the proportionality laws that I predicted in my hypotheses, I will use these laws to put together a formula to use for all wires since I know that the laws are correct. This law, if put together correctly should enable me to work out the length, cross-sectional area or resistance of a wire provided I know the other two variables.
Since it has been proven that R α l and R α 1/A, to make them an equation, I can put in the constant of proportionality, k (or p). Therefore R = kl, and R = k/A. Since both the equations have an answer to be R, I can put them together as R=kl/A. (l) is the length of the wire in millimetres, A is the cross-sectional area in mm2, and k (or p) is the constant of resistivity. This is the formula that can enable me to work out resistance, length or cross-sectional area of a length, provided I know the other two factors and the constant of resistivity. The temperature of the wire must also remain constant since the formula does not include temperature as a variable. Since each wire will have a different resistance, I know that I will need a different constant of resistivity in the formula for the wire. This can simply be worked out be rearranging the formula to be RA/l = k. Since I can work out the cross-sectional area, measure the length and use graphs to work out the resistance, I can work out the constant of resistivity.
Thus the three factors that determine the resistance of a metallic conductor, at a given temperature are:
-
the length of the wire, l; i.e. R α l
-
the cross-sectional area of the wire, A; i.e. R α 1/A
- the substance from which the wire is made
These factors are related by the equation:
Where ρ is called the resistivity of the substance and is defined as being the resistance of a piece of wire of that substance, 1m long and with unit cross-sectional area (i.e. 1m2) at a particular temperature. ρ is measured in Ωm.
EVALUATION
I have now successfully completed and analysed my investigation. I have obtained reliable results and at the same time, composed a formula relating my variables. Now I will evaluate my investigation. In doing this, I will criticise my methods of obtaining the results and I will also criticise the results that I obtained. I will also state how to improve my method and how I can improve it to obtain even more reliable results. At the end, I will also plan an extended investigation to probe further into my theories of the resistance of a wire.
LENGTH:
Overall, my investigation involving length was a success because my results turned out exactly as I had predicted. In all my graphs for length, I got very few anomalies, and most of these were due to faulty equipment. I believe that my results contained very few anomalies because my method was accurately planned in order to minimise the errors. Since my method involved repeating the experiment for each length three times, any anomalies were clearly exposed, because each repetition should theoretically produce exactly the same results. Therefore if there were any anomalies, they would stand out from the pattern of the other values. Since I repeated my experiment three times for each length, my results were also very reliable because if my results contained slight anomalies, I could simply add them to my results by taking an average (mean) of the three repetitions.
I believe that my method was highly detailed because it described each step in detail. Even a non-scientist could obtain extremely accurate and reliable results if he or she followed my method correctly. Since I followed my method exactly, I acquired highly reliable results. They were completely in line with scientific knowledge and they proved my hypothesis to be correct. The results also enabled me come up with a conclusive formula regarding resistance and length, which turned out to be correct as well.
I found that I had no problems setting up the equipment. My method enabled me to correctly connect all the wires in the right places and place all the meters in their correct positions. All the results were accurate because although the procedures in my method were highly laborious, they were in order to avoid as many anomalies as possible. My method allowed me to measure the voltage and current to two decimal places, which is a very accurate reading. I also had to measure the lengths of the wires to the millimetre for each repetition so that my experiment was fair. I also made sure that while moving the variable resistor, I moved the slider to exactly the same voltage for each repetition so that I could get identical results each time. Even though I did this, my results were very slightly different due to several reasons.
Even though my procedure was very detailed to try to avoid anomalies, there are several factors that can "ruin" the experiment. Although my experiment was not experiment was not exactly "ruined", I still got a few anomalies. But I can suggest reasons as to why they occurred. The most obvious reason is that when the electrons collide with the atoms, they lost energy, which creates resistance. This energy is transferred to the atoms, which start vibrating, and these vibrations produce heat. These vibrations deflect the path of the electrons even more than when the electrons collide with "stationary" atoms, and therefore lost greater energy. This results in greater resistance. Therefore the most obvious explanation to the anomalies is that the wire heated up a bit more than usual, therefore it produced greater resistance. This resulted in slight anomalies on my graph, but combining them with the other results, which were better, and working out an average, amended the anomalies.
Other explanations to the anomalies could be that when I repeated the experiment, I did not accurately measure the wires so the extra centimetre or so could have made the difference. Also I might not have moved the variable resistor slider to exactly the same places on the resistor, and since one part could have been slightly physically different to the other parts, there could have been greater or less resistance in that part and my results could have been slightly different due to this. While noting down the voltage and current, I might have accidentally written down the values to one decimal place instead of two, and my results would not have been accurate enough. All these factors could have affected my results so that I got a few anomalies. These anomalies were not enough to tip the balance though, and my results were very conclusive in proving my hypothesis that resistance was directly proportional to length.
Although my experiment produced accurate and reliable results under the conditions present at the time, I would not have got the same results under other conditions. For example, if I used a different type of wire, i.e. made of a different substance, I would have obtained different results because the crystal lattice arrangements of the atoms in the wire would be different and therefore the electrons would have more or less collisions, depending on the substance. This would result in a higher or lower resistance for the wire and therefore the end law of proportionality would be different. If I also varied the temperature of the wire using a globar resistor, or a similar device, the results would be different because the atoms would be vibrating differently from the original wire, and this would affect the collisions between the atoms and electrons. Therefore the law of proportionality would be different again.
I believe that I complied fully with the safety regulations and followed the safety guidelines stated in my plan. This prevented any possible accidents while ensuring I was fully protected at all times. They also enabled me to obtain reliable results since I was not putting anyone else in danger so I could concentrate on my experiment fully.
If I repeated this experiment again at some other time, there are several things I would modify in order to improve my procedure and obtain even more accurate and reliable results. First of all, for each repetition I performed, I would use a new piece of wire to make sure that the heat generated by the previous experiment did not affect the results. If I had enough resources, I would go one step further and use a new piece of wire for each reading I did to obtain perfect results. I would also do the same for the variable resistor, ammeter, voltmeter, and the wires completing my circuit, for the same reasons. I would also use an electronic device to measure the length of my wires that could measure their lengths to a tenth or even a hundredth of a millimetre, but I don't think that this would make a huge difference. I would carry out more repeats for each length and I would measure to more number of decimal places, in order to obtain a more accurate reading for each length. Also, instead of using a voltmeter and ammeter separately, I would use a multimeter, which can measure the voltage, current and resistance on the same device, more accurately. Then I would not have to go through the hassle of drawing several graphs, which are both laborious and prone to human error.
Overall, I believe that I obtained enough results to come to a conclusion about the relationship governing the two variables. Even though I could repeat my experiment several more times, it would be irrelevant to the experiment since I have already formed a conclusion regarding length and resistance, which supports my hypothesis and is supported by scientific knowledge.
CROSS-SECTIONAL AREA:
I believe that my investigation involving cross-sectional area was a success as well. The method I used for this experiment was as efficient, if not more, as the one I used for length. My results were extremely reliable and accurate, and like my results for length, enable me to come up with a valid conclusion that proved my hypothesis to be correct again, and was supported by scientific knowledge. I got a few anomalies in this experiment as well but they can be explained using the same reasons as the ones used to explain the anomalies for length.
My procedure for cross-sectional area was identical to length in a sense that I repeated it the same number of times, and I had to measure to the same number of decimal places. I also kept the length for each wire the same and measure the length accurately so that my results were fair but reliable. Since I also repeated it the same number of times, I could obtain an equally accurate average for cross-sectional area as I did for length. The only problem was a slight lack of results, since I only used five different cross-sectional areas. Therefore my results for cross-sectional area were not as reliable as they could have been. Still, they were conclusive enough for me to prove my hypothesis correct along the lines of scientific knowledge. They also enabled me to come up with a formula that related resistance to cross-sectional area, and since both the formulae (length and cross-sectional area) had constants of proportionality, I could put both the formulae together into one, which related all three variables.
If I repeated this experiment again, I would again change several things to improve the quality and the reliability of my results. First and foremost, I would use a larger range of wires of different cross-sectional area so that I have enough reliable results to make a scientifically viable conclusion. I would also use a new piece of wire after each reading, and I would use the same other methods of improvement as I did for length. I would also make sure that the conditions are similar to the ones present while I carried out this experiment, otherwise factors like temperature of the wire, and etc. would significantly affect my results.
Even though I did not have enough results to come up with feasible scientific conclusion, they were enough for me to prove my hypothesis correct and they enabled me to create a formula related to scientific knowledge. I believe that if I collected results over a wider range of wires of different cross-sectional areas, my results would only be more accurate, and they would not change my overall conclusion.
OVERALL EVALUATION:
I believe that my whole investigation has been a definite success, and I have scientifically proven my hypotheses and completed my objectives. I have come up with a conclusion and created a formula that combines all my variables together so that my formula can work for any situation. My overall method was extremely efficient at delivering suitable results and I got very few anomalies, which I could rub out by working out an average. My conclusions are supported by scientific knowledge and my formula is also scientifically correct.
Now that I have completed evaluating my experiment and its results, I will propose an extension to my investigation that will allow me to test the relationship between resistance and other variables such as temperature, density, etc. This extension should enable me to come up with a complete picture of how resistance is created in a wire and what factors affect it.
EXTENSION PLAN
Aim:
To investigate how the density of a wire (mg/mm3) affects its resistance (ohms).
Apparatus:
To effectively carry out this experiment and get the most accurate results, I have to ensure that I have the best and most accurate equipment at my disposal. I believe that the following set of equipment will enable me to obtain the most accurate and reliable results:
- A rheostat
-
An ammeter
- A voltmeter
- Insulated electrical wires
- Wires composed of the following substances:
- Gold
- Silver
- Copper
- Nichrome
- Aluminium
- Iron
- Nickel
- Tungsten
- Brass
- Steel
- Wire of c.s.a. 26 s.w.g.
- A ruler (30 cm)
- A few pieces of paper to make notes and record the results
- A pen or pencil
- Calculator
- Power supply (12 V max.)
The densities of the substances I will use as wires for my experiment are listed in a table below:
Table 5.2.1. Table of densities of various substances used as wires
The apparatus listed above will be connected as follows:
Fig. 5.2.1. How to set-up apparatus
Safety:
Since this experiment involves the use of electricity, there is always a risk of an electric shock, even if the power source in use is not very strong. Therefore, I will have to take into account all the risk factors while planning and applying my procedure.
The most important safety equipment will be the safety goggle. Since I will be using bare wire, there is always a chance of it piercing the eye. I will also always use plastic or rubber gloves while handling the wires because these substances are very good insulators and therefore I will have a low risk of getting an electric shock. As always, I will also wear an apron for safety in general. I will also have to make sure that I wear rubber soled shoes since the quickest way for electricity to flow through to the earth is through me, so if I wear rubber soled shoes, the electricity cannot pass through me.
Theory:
This extended experiment involves changing the density of the wire in order to investigate how that changes the resistance. Therefore I will first have to define density to explain how that will affect the resistance. Density can be defined as M/V, or simply how much mass of a substance is contained within a certain unit of volume, e.g. 5 cm3. Therefore I can say that in a more dense substance, there will be more mass per volume than in a substance with low density. Therefore, there will be more atoms of that substance per unit volume. This is where the resistance comes in. In a wire with relatively high density (see below), the atoms are very closely packed together, and therefore there are more atoms in a certain space. This means that there are more atoms for the electrons to collide with, so the electrons lose more energy. Therefore the resistance is greater. If you double the density, you double the number of atoms per unit volume, and therefore you double the number of collisions between atoms and electrons. The wire with twice the original density will therefore have twice the original resistance.
Fig. 5.4.1. Electrons in a dense wire
The same applies for lowering the density. If you halve the density of a wire, you halve the number of atoms per unit volume. Therefore there are fewer atoms for the electrons to collide with and more space for them to pass through. Therefore this wire will have half the resistance of the original wire since the atoms lose half the energy lost in the original wire.
Fig. 5.4.2. Electrons in a less dense wire
In the first diagram, e.g. of tungsten, the atoms are very tightly packed together in a crystal lattice, and there are a lot of atoms in a small space; therefore tungsten has a high density. All the electrons in that wire collide with atoms and therefore they lose a lot of energy, which is converted into heat by the atoms. This gives tungsten such a high resistance, and it can be used in filament lamps.
In the second diagram, e.g. of copper, the atoms are packed a lot less loosely together and there are a lot less atoms in the same space; therefore copper has a low density. Only two of the electrons in the diagram collide with atoms, therefore they lose a lot less energy, and this gives copper its low resistance. Copper is the most common element used in electrical wires.
Prediction:
As I have stated in my theory above, if you increase the density of a wire, you increase the number of atoms, which increases the number of collisions. This results in the wire having a higher resistance. Therefore, I predict that resistance will be directly proportional to density. This is only to a certain extent though, since a substance cannot have infinite density, otherwise it would be a singularity. Therefore my graph would look like the following:
Fig. Predicted graph of resistance against density
I predict that the graph will represent this because although the density can increase forever till it is infinite, the resistance will slow down increasing after a certain point because the atoms will be slow closely packed together, that increasing the density a tiny bit more will not make a difference to the resistance. The electrons will simply not have any space to move and will lose all their energy. But at infinite density, the resistance will have to be infinite as well; therefore the resistance will be directly proportional to density.
GRAPHS
As attached in the following 1+ 31 sheets