Water:
Water is also an important factor in photosynthesis. If plants are lacking water, their stomata close up to prevent even more water loss. At the same time, if the stomata are closed, CO2 cannot enter the plant meaning the rate of photosynthesis will decrease. Water can be kept constant by keeping the same amount of it in the beaker.
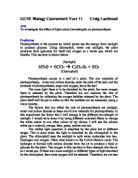
The formula for photosynthesis is:
6CO2 + 6H2O → C6H12O6 + 6O2
Carbon Dioxide + Water using light energy & chlorophyll → Glucose and Oxygen
Leaves:
Leaves have a large surface area and are very thin. This is ideal for photosynthesis, as is the palisade tissue situated just under the upper epidermis. Palisade cells are long cells packed closely together with lots of chloroplasts. The spongy mesophyll cells can also photosynthesise, but they act as a kind of packing tissue with a large amount of air space for gases to circulate in. The lower epidermis has smaller openings, stomata, to allow gases to enter the leaf, or leave it, e.g. CO2 might enter the leaf, O2 might leave it. When the stomata are open, water vapour can escape. This is known as transpiration.
Light:
Light provides the essential energy for the process of photosynthesis. With little light little photosynthesis will take place no matter how much CO2 is present and how warm it is.
HYPOTHESIS:
In our experiment we are trying to see the affect of light on photosynthesis. What would happen if the light was increased, or decreased?
I predict that the more light falls on our piece of Elodea, the more the plant will photosynthesise. This is because there will be more energy provided to drive the food-making process.
The less light that falls on the Elodea, the less energy will be given to the plant to photosynthesise, meaning less oxygen will be released.
I also think that increasing the light intensity will increase the rate of photosynthesis at a proportional rate where LI is inversely proportional to 1/d where LI = light intensity and d = distance (from the light source to the plant).
METHOD:
Apparatus – lamp, beaker, test tube, Elodea, thermometer, timer.
We collected the apparatus and set it up as shown below. To make sure our experiment was a fair test, we had to control everything around the experiment.
The Elodea was placed in a test tube filled with water, and this was placed in a beaker containing water. This was so that the water could not heat up from the lamp, as this could affect the results. A thermometer was used to measure the temperature to make sure it was constant so that it was not too hot or cold.
The light source was also controlled. Blinds were pulled down in the room so that the pondweed would only receive the light from the lamp. External light could provide extra energy, and this could therefore give us inaccurate results.
Three reading were taken from each of the distances at which the plant was placed. The number of bubbles of oxygen produced was counted and also the size of them was recorded. The readings were taken for the duration of one minute.
CONCLUSION AND ANALYSIS:
From the results shown on the previous pages, we can plainly see that as the distance from the plant to the light source increases, the number of bubbles of oxygen released decreases. In other words, as the light intensity is decreased, so is the rate of photosynthesis. As it increases, more bubbles are produced meaning an increase in the rate of photosynthesis. In all four of my graphs the lines were non-linear. In graphs 3 & 4 the photosynthesis can be seen to increase at an exponential rate.
Graphs 1 & 2 obviously show that as the distance from the Elodea to the light source was increased, the number of bubbles produced per minute decreased, meaning less oxygen was given off. There would eventually be a point where there would be no bubbles produced, and so no photosynthesis would be taking place.
My results however did not quite agree with my statement that light intensity is inversely proportional to the distance squared. Although this rule does exist there is quite a large margin of error on my results. The lines in graphs 3 & 4 will eventually reach “0” where photosynthesis would stop as light intensity limits this rate.
In graphs 3 & 4 where the lines begin to straighten out can be explained because of other factors limiting the rate of photosynthesis. These factors affect the rate of photosynthesis rather gradually. The photosynthetic rate is limited by other factors even though the light intensity is increasing. These factors could be carbon dioxide supply or even the temperature. These factors could limit the rate of photosynthesis to the point where it is completely limited and the graphed lines go horizontal. This means that photosynthesis is being carried out at a constant rate.
Light intensity is inversely proportional to the distance squared because the light energy spreads out as it travels further and further from its source. Light energy travels along the circumference of an expanding circle. When light energy is released from a point, the energy is dispersed equally along the circumference. But since the circle is expanding, the circumference increases and the same light energy is distributed along a greater surface. This can help to explain why the rate of photosynthesis decreases as the Elodea plant moves further away from its light source.
EVALUATION:
I think, although our experiment was carried out well, there were a few mistakes that could be rectified if we were to repeat this experiment.
Firstly, there could have been a number of limitations, or inaccuracies, which caused anomalous results. For example, we did not control the CO2 intake, as we did not add sodium hydrogen carbonate.
However, we did manage to control the temperature of the water and ensure it was kept at 29°C. We also managed to control the amount of light falling on the Elodea as the blinds in the classroom were pulled down to prevent any external light from reaching the plant.
The counting of the bubbles of oxygen given off by the plant might not have been as accurate as possible because the bubbles were rising up very fast at the start (they slowed down as the light source was further away) and it was difficult to keep up the counting. It might have been better to weigh the amount of oxygen given out, and the way to do this is explained below:
In this experiment, as the Elodea gives out the oxygen, it gets collected in the syringe. The more oxygen is present, the further back the plunger will go. This would be a more accurate way of measuring how much oxygen was given out because there would be no difficulties at measuring the number of bubbles, like there is when this experiment is done manually. The beaker containing water can still be moved to different distances, and the temperature can be kept constant by placing a glass block in front of the beaker.
In order to expand this experiment, it might be wise to use a different species of plant, like possibly using a different water plant. We could also try varying something other than the light, i.e. carbon dioxide intake, temperature, or water supply. Again, we would have to make sure that all variables, apart from the experimental variable, were kept the same.