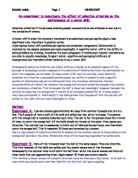
In this specific experiment, we can say that if we increase the volume of Pectinase (the enzyme) the rate at which the pectin interacts with the active site of the enzyme will increase, therefore the rate at which the juice comes out of the stewed apple will also increase.
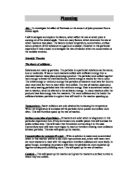
Enzyme Activity
0°C 45°C
Enzymes are usually damaged by temperatures above about 45°c, and as the graph shows, their activity drops off sharply when the temperature gets too high.
Preliminary Work
In class we have performed a similar experiment involving the rate at which juice comes out of a stewed apple. However this time there were only two stewed apples, one solution contained the enzyme pectinase and the other without it. From doing this experiment, I found that the solution with Pectinase clearly produced more juice at a faster rate, than the solution without Pectinase. This proves that enzymes will greatly increase the rate of formation of the product. From doing that experiment I learnt a lot of things, which I would have to change in my final experiment, for example a more accurate measuring cylinder.
Prediction
I predict that if I double the concentration of Pectinase, the rate at which the juice comes out of the stewed apple will also double. And the reaction time will be cut in half. This is because as the volumes of Pectinase will increases therefore there will be more Pectin interacting with the active site of Pectinase, therefore more cell walls will be breaking and more juice will be produced. Also, because of the simple concept that before particles can react they must collide, therefore there will be more particles in a smaller volume therefore collision between particles will be more likely and consequently the reaction will speed up. I can also predict that if I half the concentration of Pectinase, this will also half the rate at which the reaction takes place and the time taken for the reaction to take place will double. This is because the decreased number of particles also means that the chance of collision will also reduce. Therefore the time taken for the cell wall in the apple to break will decrease and result in less juice being produced over a certain period of time. I also predict that the amount 0of juice produced will be proportional to the time.
Apparatus
- Pectinase (enzyme used to break cell wall)
-
4 - 100cm³ beakers
-
10cm³ measuring cylinder
- Stewed Apples (chopped up)
- Filer paper
- Water
- Stop- clock (to record the amount of juice being produced)
- Scale (used to measure the mass of the steed apples)
- Funnel
- Syringe
Variables
The variable, which will be changed in this experiment to alter the rate of reaction, is concentration. At least five readings are needed in order to draw a graph and to have significant amount of results, to prove he prediction. The concentration of Pectinase will change, as water will be added to dilute it. The total volume of Pectinase and water in each experiment will always be 5cm³ making it a fair test. The table below shows the different concentrations used in the experiment
Plan
- The apparatus will firstly be collected and set up.
- The stewed apple will be weighed in a 100cm³ beaker.
- The volume of Pectinase and water will be taken out of the container using a syringe.
- The Pectinase and water will be measured using a measuring cylinder (10cm³)
- This solution of Pectinase and water will be stirred.
-
Some filter paper will be placed in the funnel and the funnel will be placed on top of the solution containing Pectinase and water.
- Add the stewed apples to the solution and immediately start the stop clock.
- Filter the juice from the stewed apple, using filter paper.
- Record the amount of juice produced every minute.
- Stop timing after 6 minutes.
- Repeat the experiment for the other different concentrations.
Equipment Used
Obtaining Evidence
Results Tables
Concentration of Pectinase to water:
5:0 4:1
3:2 2:3
1:4 0:5
The experiment was repeated again to get accurate results and averages.
2nd set of results
5:0 4:1
3:2 2:3
1:4 0:5
This table shows the average set of results. This was done in order to get the most accurate results.
Graphs Showing Results 1
Graphs Showing Results 2
Graphs Showing the Average Results
Analysing and considering evidence
Each of the graphs clearly shows the same pattern and trend occurring between the amounts of juice produced in the given time of 6 minutes. This pattern occurring is that as you increase the concentration of Pectinase the amount of juice being produced from the stewed apples is increasing. The readings for each set of results may vary, however the same trend is occurring in all of them.
Both enzyme and substrate concentration affect the rate of reaction. Clearly, as the concentration of Pectinase increases, the number of active sites also increase. Provided that there is an excess of substrate molecules, the rate of reaction increases in proportion to the concentration of Pectinase.
The line on the graph therefore should be a straight line.
From the graphs we can see that as the concentration of Pectinase gets higher the line graph gets steeper. For example for the first set of results, at 1 minute the amount of juice produced for the concentration 5:0 is 3.2cm³ , however for 2:3 the amount of juice produced is 1.4cm³. The general trend occurring is that the rate at which the juice is being produced is clearly speeding up as the concentration of Pectinase increases. The pectin’s hold the fruit cell together like “glue”, however when the Pectinase enzyme is added this “glue” is broken and juice comes out.
As the concentration increases the rate at which juice comes out increases. These trends are occurring because as you increase the amount of Pectinase which is the enzyme the substrate combines with more enzymes in the active site therefore there will be more juice produced in a shorter time. As there will be an increase in the amount of Pectinase, the rate at which the enzymes break down the cell walls to extract the juice will increase.
The line of best fit was drawn on the graphs as this shows the general trend between the variables and whether the points are following this pattern. From my graph showing the average of the two sets of results, I can say that when I doubled the amount of Pectinase the amount of juice produced did not double. For example when the concentration of Pectinase was 1:4 the amount of juice produced in a minute was 1cm³, when I doubled the amount of Pectinase to 2cm³ the amount of juice produced in a minute was only 1.2cm³. I would expect the amount of juice to be produced to double as the interaction between the Pectin and the Pectinase to also double. This however is clearly not the case for my set of results. The Pectinase enzyme works best at a slight acidic PH, the optimum PH is about 4.8 to 5. This is where the enzyme works best as it is most active. At extremes of PH the Pectinase molecule may become denatured. As it will cause changes in the protein structure and this will change the binding of the substrate which in this case was Pectin to the Pectinase.
The Pectinase enzyme has a specific temperature at which it works best at. Pectinase works best at a temperature between 45°C - 55°C. In my case the reaction took place at room temperature consequently the optimum activity of the Pectinase enzyme was not achieved which is a factor which will affect our results and make them not as accurate if the optimum temperature was used. If the substrate concentration increases the reaction will only increase until all enzyme molecules are being used.
In my prediction I predicted that the rate at which juice comes out of the apple will increase as the amount of Pectinase will increase, which by the shape my graphs it clearly proves that it is true. However I also predicted that as the amount of Pectinase doubled the rate of reaction will also double, this was not true. This may be due to the fact that the optimum PH of about 4.9 may not have been achieved as well as the optimum temperature of about 50°C was not reached either. Therefore my prediction cannot be entirely proven, as certain factors were not attained. I thought that the concentration of the Pectinase will be the same through out the whole 5 minutes despite the fact that there will be less of the solution. I believe that the reason why the amount of juice produced isn’t proportional to the time is because the concentration of Pectinase did not stay constant through out the experiment
Evaluation
I feel that this experiment went to plan. Due to the limitation of time we were unable to record a third set of results for accuracy. There however may have been differences between the two sets of results, as my partner and I split the experiment. A sufficient number of readings were taken, as I was able to draw graphs from the results. The equipment and apparatus used was fairly good.
Our results were fairly accurate as we repeated the experiment. We also made sure that our measurements were accurate. We started and stopped the stop clock at the same time in each experiment. An accurate scale was used o weigh the mass of the stewed apple. We also made sure we measured the Pectinase and water in the appropriate measuring cylinders at eye level. We then compared our results with another group doing a similar experiment. The graphs also prove that the experiment was fairly accurate as the line was relatively straight.
From our results we found that we had an anomalous result. This was in the second set of results. It is showing the line graph for the concentration 2:3. This may have been caused by human error, which sometimes can be unavoidable. The following human errors may have affected the results are:
- The starting and stopping of the reactions may have been different.
- The measurements of Pectinase, water and stewed apple may have been incorrect.
- Incorrect methods may have been used.
- The person doing the experiment changed therefore there may have been different methods used.
Another possible factor that may have altered the results from the general pattern is that the experiment was done on different days therefore the temperature of the reaction changed and this may have affected the enzyme activity. If the Pectinase was defected and not fresh this may have caused error in results.
We could have made our results more reliable by repeating them more time and could have used a larger range of concentrations. Another factor we could have achieved in order to make our results more reliable is for the same person to do all the experiments.
Improvements could have been made to the apparatus as a more accurate stop clock could have been used, and the experiment could have been repeated more times. The same Pectinase bottle should have been used for all the experiments, as the some bottles may have been older than the others, which also would have altered the results.
To further this experiment I could investigate various fruits with the Pectinase enzyme, and explore which of the fruits would produce juice at the quickest rate. I would investigate with this with the following fruits banana, apple and Orange. I could also investigate this at various temperatures. From this I would predict that the higher the temperature the faster the rate at which the juice comes out. This would however only be true until around 50°C, after this temperature the Pectinase enzyme would denature. I would also predict that the orange would produce the most juice in comparison to the other fruits as it has higher percentage of water content.
Bibliography
I used the following books in my investigation:
- “Biology for you” by Gareth Williams. I found this book very useful in explaining the lock and key hypothesis.
- “G.CSE Double Science Biology. The revision Guide Higher Level. This book was quite useful in explaining enzyme action.