To Investigate water uptake by Plant Cells
Biology Coursework : To Investigate water uptake by Plant Cells
1. Introduction
2. Diffusion
3. Active Transport
4. Osmosis
5. Osmosis
6. Variables
7. Temperature
8. Size, Amount, Weight
9. Prediction, Bibliography
[1][1]
All plants need water to survive and I am going to investigate how
plants uptake water by doing an experiment with potatoes and water to
see how the potato uptakes the water and the different factors that
effect the way it takes up the water.
I am planning to investigate the uptake of water by plant cells. I am
going to investigate the water in and out of cells. Water can move in
and out of cells three different ways: -
1. Diffusion
2. Active Transport
3. Osmosis
[2][2]
. Diffusion
Diffusion is the movement of any molecules from where there are lots
to where there is less. Molecules diffuse down a concentration
gradient from high to low concentration. Diffusion stops when the
molecules are equal in concentration.
The greater the difference in concentration, the faster the rate of
reaction.
Here are diagrams showing different types of diffusion: -
Diffusion in water: -
Substances pass in and out of cells as tiny particles called
molecules. The molecules and liquids and gasses are never still. They
keep moving and bumping into each other al of the time.
You can show that molecules move by adding a drop of ink to water. Ink
spreads through the water even though it is not stirred. Ink spreads
because ink molecules move into the spaces between water molecules,
and water molecules move into the spaces between ink molecules.
Movement of molecules so that they mix is called diffusion. Molecules
diffuse from where there are plentiful to where there are less
plentiful. In other words molecules diffuse down a concentrated
gradient from high to low concentration.
Here is a diagram to show how the ink diffuses through all the water.
A beaker with water in and a drop of ink
The drop of ink starts to diffuse and move between the water molecules
Diffusion finishes when the concentration is equal.
[image001.gif] [image003.jpg] [image004.gif]
[image005.gif] [image006.gif] [image003.jpg]
[image007.gif] [image008.gif] [image003.jpg]
[image009.gif] [image010.gif] [image010.gif]
[3][3]
Diffusion in and out of cells
Human body cells need a constant supply of food and oxygen to stay
alive and do their jobs. Food and oxygen are carried in the blood, so
they diffuse from the blood into each cell.
As cells use food and energy, they produce carbon dioxide waste. This
must be removed before it poisons the cells. Carbon dioxide diffuses
from cells into the blood, which carries it away to the lungs to be
breathed out of the body.
Here is a diagram showing the diffusion in and out of cells.
2. Active Transport
Substances are sometimes absorbed against a concentration gradient.
This means plants absorb ions from very dilute solutions in this way
i.e. Actively. This takes place in the opposite direction to which
normal diffusion would occur. This process is called Active Transport
and it requires energy from respiration to take place. In humans sugar
may be absorbed from the intestine from the kidney tubules by active
transport.
The diagram below shows Active Transport.
[4][4]
3. Osmosis
[image011.gif] Osmosis is a special kind of diffusion, it happens when
a membrane has tiny hole in it which let the tiny water molecules
through but stop larger molecules like sugar passing through. A
membrane like this is called semi-permeable, this experiment shows
osmosis: -
Strong solution
[image012.gif]
Weak solution
[image012.gif] [image012.gif] [image012.gif] [image013.gif]
[image012.gif] [image012.gif] [image012.gif] [image012.gif]
[image014.gif] [image015.gif]
A semi-permeable membrane is tied to a tube. It is then filled with
strong sugar solution
The liquid rises because water molecules diffuse through the membrane
from the weak solution to the strong one. But sugar molecules cannot
diffuse like this because they are too big to pass through the
membrane.
The membrane is stood in a weak sugar solution. Soon liquid starts to
rise up the tube.
When a weak solution is separated from a strong one
by a semi-permeable membrane, water always flows
from the weak solution to the strong one. This diffusion
of water is called Osmosis.
[5][5]
Osmosis in plant cells
Water moves from cell to cell in plants by osmosis. The cell membrane
of a plant cell is semi-permeable. So if a cell containing a weak
solution is next to a cell with a stronger solution, water moves by
osmosis from the weak to the strong solution, as shown in this
diagram.
[6][6]
Variables
All the following variables I can control. (INDEPENDANT)
* Surface area and length...Controlled by the borer
* Weight known at start...Measured by an electronic balance
* Length at start...Controlled by ruler and blade
* Temperature...All solutions and potatoes at room temperature
* Volume of sugar solution...Must cover all the potato chip
* Length of time potato chip is in solution...Controlled by clock
* Concentration of the sugar.
All the below variables are the ones I cannot control. There the ones
I find out at the end.(DEPENDENT)
* Weight of potato chip at the end after being dried
Our investigation
In our investigation we are going to investigate the water uptake by
plant cells. This involves Osmosis and the factors that will affect
osmosis are: -
1. Temperature (independent)
2. Time (independent)
3. Size (surface area) (independent)
4. Amount (independent)
5. Weight (dependant)
[7][7]
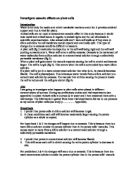
. Temperature
In an experiment you must always keep the temperature of the
experiment constant otherwise the results will be incorrect, To keep
it a fair test the temperature must be kept the same at all times
because the hotter the temperature is the faster the molecules move.
Therefore if a potato was ...
This is a preview of the whole essay
plant cells. This involves Osmosis and the factors that will affect
osmosis are: -
1. Temperature (independent)
2. Time (independent)
3. Size (surface area) (independent)
4. Amount (independent)
5. Weight (dependant)
[7][7]
. Temperature
In an experiment you must always keep the temperature of the
experiment constant otherwise the results will be incorrect, To keep
it a fair test the temperature must be kept the same at all times
because the hotter the temperature is the faster the molecules move.
Therefore if a potato was put in a high concentration of water osmosis
would take place because there is more water outside the potato than
there is in it so the it will diffuse the water from where there is
more to where there is less across a semi permeable membrane. If the
temperature were increased this process would occur much faster.
Here is a diagram showing the speed of molecules: -
[image016.gif] [image017.gif]
2. Time
The experiment has to be kept under a strict time scale. All the
potatoes must be put in at the same time and taken out at the same
time. If not this may result in an inaccurate table of results. If one
is in longer than the other it could result in one having a heavier
weight than it should because it has had more time to pass the semi
permeable membrane.
[8][8]
3. Size
If you have one short potato chip and one long potato chip it wont be
a fair test, since the surface area would be greater and there is more
chance of osmosis occurring through the semi permeable membrane. The
greater the surface area the greater the chance of water molecules
being in the potato so there is a greater chance of Osmosis occurring.
When the surface area is larger there are more cells in contact with
the solution, therefore more gaps for the water to move through.
4. Amount
I the experiment, it needs to make sure that if the result is to be
accurate we have to make sure that the potato is covered in the
solution and it is not exposed to the air. If it is exposed to air
then it will decrease the surface area of which osmosis can occur.
5. Weight
The weight of the potato also needs to be known before it is put into
the solution and we need to know the weight of it after it has come
out of the solution, so we can record a result of the water uptake in
and out of cells. So we will know if the weigh has increased or
decreased.
Each of the above Independent variables above has an effect on the
results. I'm going to investigate the effect of 5 solutions in
varying concentration all 5 potato chips have to have the same surface
area, otherwise more water will be absorbed in some and in others more
water particles will move out into the sugar solution. This then
effects the end weight. All 5 potato chips must be in a beaker/petri
dish or boiling tube labelled A-E, for the same length of time,
because if you leave one in for less time than the other then it has
less time for osmosis to occur so it means the weight at the end is
wrong. All 5 beakers/petri dishes will have sugar in them, however not
of the same concentration. Some will have more and some will have less
and in one dish I will have no sugar in it. The concentrations are as
follows: 0M, 0.5M, 1M, 1.5M, 2M. This means all the potato chips will
have a different weight at the end. Some will have decreased and some
increased.
[9][9]
Prediction
I predict that the potato in petri dish A1 will increase in weight
because the solution has no sugar molecules only water molecules. This
means there is a greater chance of there being more water molecules in
the solution than in the potato, which means the water molecules will
move from the solution to the potato increasing the weight at the end.
In petri dish B1 I predict that the potato will increase in weight
because there are more water molecules in the solution than in the
potato and osmosis is the movement of water molecules from where there
is more to where there is less. I predict that petri dish C D and E
will decrease in weight because there are more water molecules in the
potato than in the sugar solution and osmosis is the movement of water
molecules from where there is more to where there is less, so the
molecules will leave the potato.
Bibliography
I used the following books to help me with my coursework: -
* My school exercise book.
* The essential of G.C.S.E. Double Award Biology.
* G.C.S.E in a week Biology.
[10][10]
Method for Practical
Safety
To make sure that the operation is safe I will make sure that I am
working in a safe environment by: -
· Making sure all chairs and other obstructions are out of the
way.
· Wearing safety goggles and other protective clothing when
needed
· Clearing up any mess made.
· Make sure all bags and coats are out of the way.
· Take all food out of the working environment.
· Dispose of all chemicals and chemical residues safely, with
an awareness of your environment.
· Consider working teammates and their safety at all times.
· Assembling the correct apparatus and materials.
· Be aware of the health and safety rules and regulations.
Check you are working in a safe environment.
Here is the method on which it is going to investigate the uptake of
water by plant cells by changing the concentration.
List of apparatus
* Potato
* Borer
* Electronic scales
* Petri dishes x 5
* Ruler
* Blade
* Sugar solutions (0m, 0.5m, 1m, 1.5m, 2m)
* Paper towels.
* Labels
To keep a fair test
To make the experiment fair I will need to consider the following
factors: -
* The potato chips will need t be kept at room temperature at all
times
* The potato chip must be kept in the solution for the same time as
all of the other chips.
* The surface area of the potato chip will have to be cut with an
effort to make it the same surface area as all the others
What I will need to do
Firstly the environment that is going to be worked must be clear of
all inappropriate objects. Then apparatus will be collected and
assembled correctly.
The potato will then be cut with a borer to produce 5 cylinders,the
borer helps make the surface area constant because it keeps what it
cuts at the same width. The cut pieces of potato will then need to be
measured to 2cm in length and then cut using the provided blade. Once
this process is done the results will be recorded onto a table.
5 petri dishes will then be filled with sugar solution. All 5 being a
different concentration. The dishes will be labelled D0, D0.5, D1,
D1.5, D2 and put A in 0M of solution. B in 0.5M of solution. C in 1M
of solution. D in 1.5M of solution and E in 2M of solution.
Then using an electronic balance the weigh all 5 potato chips will be
weighed separately and the weight of potato A B C D E will be recorded
on a table of results.
Once they are weighed one slice of potato will be placed in every
petri dish with the lid of the dish put on so no dust or other
substances can affect the experiment. The stop clock will then be
started.( potato A in petri dish D0, potato B in petri dish D0.5
etc...).
The experiment will be undertaken in room temperature to make sure the
test will be fair. The potato will then be put into the solution and
left there for 20 minutes.
When the time has reached 20 minutes, the potatoes will be removed
from the petri dish and patted dry with a paper towel. Making sure you
still know which, potato is which potato.
Another experiment needs to be done where the potato's are left in the
solution for 2 hours. After this period of times the weight and length
will need to be recorded.
When the potato's are dry they will then be measured again and then
weighed again, all this will be recorded on a table of results as it
happens.
This whole experiment has to be repeated at least once to make the
results more accurate. The potato's will be labelled A1, B1, C1, D1,
E1. And they will be on a different table of the same style.
Analysis
To Analyze my evidence I am going to study the results from my graphs.
I will start off with my first graph "% gain or loss of weight" and
look at what happened to each potato for the duration it was in the
solution.
Potato A
Potato A after being in the water solution for 20 minutes showed that
there had been no change in its weight, this means that osmosis had
not started to begin. After 2 hours the gradient of the line on the
graph increased, this shows that osmosis has started. This means that
there were more water molecules in the solution than in the potato so
the particles moved from the solution to the potato increasing it in
weight. Water particles move from a high concentration to a low
concentration across a partially permeable membrane(cell wall). Since
the potato in water increased in weight it proves the theory. Then by
24 hours the graph showed that the weight had yet again increased in
weight even more, and the graph showed a steeper gradient i.e. the
rate of osmosis had increased, this tell me that if we had checked the
weight after 48 hours the weight of Potato A was likely to have
increased even more.
Potato B
Potato B displayed on the graph showed me that after 20 minutes there
had been no change, showing that osmosis had not yet taken place. By
the time that the potato was in the solution for 2 hours it still
remained at its original weight showing that nothing has affected its
weight. Even after 24 hours there still has been no change in weight.
I think because no osmosis took place the solution inside the potato
was the same concentration to the solution that it was in.
Potato C
Potato C decreased by 2.20% in the first 20 minutes showing that
osmosis has occurred. This also shows me that the stronger the
solution the faster the reaction is. By 2 hours the weight had
decreased again but at a steeper gradient showing me that the reaction
had quickened up. By 24 hours the weight had increased by not as much
of a bigger leap than before. The gradient was getting shorter,
showing that osmosis was coming to an end.
Potato D
Potato D was in a 1.5 molar sugar solution and it decreased by 3.52%
showing me osmosis had began, this proves my theory stated earlier
"the stronger the solution the faster the reaction." By 2 hours the
gradient of the line had increased and lost over 15% of its original
weight. By 24 hours the gradient had gained a steeper gradient, this
shows me that if the experiment was continued for another 24 hours the
weight would have decreased even more.
Potato E
Potato E placed in a 2 molar sugar solution decreased by the most
(6.31%) in 20 minutes. By 2 hours it had increased in weight and the
gradient of the line was at its steepest, this is because the higher
the concentration the faster the reaction. When the potato had been in
the sugar solution for 24 hours then the gradient of the line started
to fall so the reaction was slowing down. This shows me that after 2
hours the main bulk of the water was extracted from the potato and
osmosis was decreasing i.e. osmosis has nearly finished (diffusion
only stops when the two concentrations are equal ).
The next graph that was drawn up was "% gain or loss of length" and I
will look again at each potato.
Potato A
Potato A before 20 minutes which was in water solution has not changed
its length which shows clearly that osmosis has not occurred because
there was also no weight change before 20 minutes. By 2 hours the
graph showed that the length has increased by 2.86% which shows that
osmosis has started and this is proved by the weight changing before 2
hours. The length seemed to have stopped by 24 hours, this doesn't
seem right when in the weight change graph it seemed to keep
increasing in weight. I feel that because there was an increase in
length there must have extracted water from the solution and the cells
have expanded to fit in this extra solution. i.e. extra molecules.
Which gave the potato more space to gain weight by extracting more
water.
Potato B
Potato B stayed at its original length all the way through the
experiment. This is because osmosis did not take place. This proves my
earlier theory of this potato being in a solution that is to the same
concentration as inside the potato.
Potato C
Potato C decreased in length before 20 minutes, which I would have
predicted that it would have because it fell in weight before 20
minutes in the weight change graph. From 20 minutes all the way to 24
hours there was no change in length at all. Which seems strange
because the weight was increasing rapidly.
Potato D
Potato D Decreased in length by 2.86% before 20 minutes which was the
same for potato C. The length then kept constant till 2 hours when it
decreased (5.86%). I think this was because the weight decreased so
much so the cells shrived up. When the potato was taken out of the
solution after 24 hours it was all limp and soggy this was because all
of the most was extracted from it.
Potato E
Potato E lost the most length by 20 minutes. This matches the weight
change graph because the most weight was lost in this time too. From
the 20 minutes onward the length kept constant, this is because it had
already lost so much length and it showed in the weight change graph
that osmosis was ending, so the length would not need to decrease any
more.
The next graph that was drawn was "Average % change graph for weight"
of both experiments that were taken out and I will be looking at the
average results that I have found from both experiments for an overall
result.
Analyzing this graph, it shows me a better view of what happened to the
potatoes. It shows that potato A needed more time for osmosis to finish
because the gradient of the line was still increasing by 24 hours. Potato B
increased slightly and kept at a constant weight throughout the experiment,
which shows me that osmosis finished quite early in this potato. Potato C
Showed that the gradient was getting shorter, showing that osmosis
was coming to an end. This was the same for Potato D and E, so it
shows me that osmosis had nearly finished by 24 hours.
The next graph that was drawn was "Average % change graph for length"
of both experiments that were taken out and I will be looking at the
average results that I have found from both experiments for an overall
result.
Analyzing this graph I find that it give clearer information than the
other experiments. It shows accurate results for Potato A and C but
not so accurate results for the other potatoes. It shows that potato B
has lost length when in the Average weight graph it shows an increase
in weight. In potato D and E it shows that after 2 hours they decrease
in length when in the average weight graph they stop gaining weight
after 2 hours. This may be because the cells think that osmosis is
still taking place.
From all of my result, I have found how osmosis reacts in different
water solutions: -
0m (water)- the potato increases in weight and in length. This is
because there was a higher concentration of water molecules outside
the potato so diffusion occurs extracting water particles from the
solution through a semi permeable membrane until the water particles
are equal either side of the semi permeable wall.
0.5 m- 1m (weak sugar solution) - there is virtually no change in the
potatoes weight and length indicating that no osmosis took place
because the solution inside the potato was the same concentration to
the solution that it was in.
1.5m - 2m (strong sugar solution) - There was water moved by osmosis
from the potato to the solution because there was a greater
concentration of water molecules inside the potato cells than in the
solution so osmosis takes place and the potato decreases in weight and
length.
Also from my results I found that the rate of the reaction occurred
faster when there was a stronger sugar solution. I believe that this
was because there was a steeper concentration gradient between the
potato and the sugar solution so more water in the potato cells that
in the stronger solution so the water was extracted from the potato
cells at a faster pace.
These results confirm most of my original prediction that potato A
will increase in weight because "the solution has no sugar molecules
only water molecules." My results did prove that potato B would
increase in weight but it did not prove that there would be a decrease
in length, I think that this decrease in weight may just have been a
human error of judgement. Potato C,D and E were all confirmed in the
prediction to being the same in my results by the fact that they all
decreased in weight.
Evaluation
I am pleased with the results that I have found from my experiment to
find the uptake of water by plant cells. I feel that I have reached
all my aims in this project and have found how and why plant cells
uptake water.
Looking at the accuracy of my result I feel that it went well because
all my results were at a satisfactory standard, I even repeated the
experiment for improved accuracy and made two average graphs to make
an overall result. When I look back at my graph in the first
experiment I found that the % gain or loss of length was not as
accurate as the second experiment. I feel this because in the second
experiment I had a wider range of values and the graph was more spread
out. The average % gain or loss graph of length averaged out the
results giving me a better result.
I feel that all the procedures that were taken out were done under
great precautions of accuracy, one of the faults that did occur was
that the timescale was a bit wrong, in the sense that we could not
return to our experiment on the exact time that we were suppose to,
this was because it clashed with other lessons. Another fault was the
human error, because nobody is 100% accurate in the sense that reading
off apparatus and measuring objects can never be 100% accurate.
I do think that the evidence that we did record was at a good standard
of accuracy and it does provide enough evidence to draw a final
conclusion. My work proved that the concentration of the solution
affects the direction of movement in water. This happens because
water molecules move from a dilute solution to a concentrated
solution. It also enabled me to form a valid conclusion about osmosis.
A gain in weight occurs when every cell takes in water, therefore
every cell gets larger and heaver. A loss in weight occurs when water
leaves the cell to go into the solution.
I feel that this project and procedure did need improvements in the
sense that I feel we needed more time because it would mean that I
could do more repeats of each sugar solution and therefore there would
be an increase in accuracy which would enable me to obtain more
conclusive results. Another improvement would be to split up the class
into 2 groups to do the experiment at different times, this would
increase space and make it easier to carry out the experiment
satisfactorily. As it was I found it quite cramp and busy and this
hindered me in carrying out my experiment.
_______________________
[11][3] Deri Reed
Chemistry Coursework
Mrs. Sanders
[12][4] Deri Reed
Chemistry Coursework
Mrs. Sanders
[13][5] Deri Reed
Chemistry Coursework
Mrs. Sanders
[14][6] Deri Reed
Chemistry Coursework
Mrs. Sanders
[15][7] Deri Reed
Chemistry Coursework
Mrs. Sanders
[16][8] Deri Reed
Chemistry Coursework
Mrs. Sanders
[17][9] Deri Reed
Chemistry Coursework
Mrs. Sanders
[18][10] Deri Reed
Chemistry Coursework
Mrs. Sanders
References
Visible links
1. file://localhost/var/home/acumen/svn/trunk/engine/docs/working/4831/4831.html#_ftn1
2. file://localhost/var/home/acumen/svn/trunk/engine/docs/working/4831/4831.html#_ftn2
3. file://localhost/var/home/acumen/svn/trunk/engine/docs/working/4831/4831.html#_ftn3
4. file://localhost/var/home/acumen/svn/trunk/engine/docs/working/4831/4831.html#_ftn4
5. file://localhost/var/home/acumen/svn/trunk/engine/docs/working/4831/4831.html#_ftn5
6. file://localhost/var/home/acumen/svn/trunk/engine/docs/working/4831/4831.html#_ftn6
7. file://localhost/var/home/acumen/svn/trunk/engine/docs/working/4831/4831.html#_ftn7
8. file://localhost/var/home/acumen/svn/trunk/engine/docs/working/4831/4831.html#_ftn8
9. file://localhost/var/home/acumen/svn/trunk/engine/docs/working/4831/4831.html#_ftn9
10. file://localhost/var/home/acumen/svn/trunk/engine/docs/working/4831/4831.html#_ftn10
11. file://localhost/var/home/acumen/svn/trunk/engine/docs/working/4831/4831.html#_ftnref3
12. file://localhost/var/home/acumen/svn/trunk/engine/docs/working/4831/4831.html#_ftnref4
13. file://localhost/var/home/acumen/svn/trunk/engine/docs/working/4831/4831.html#_ftnref5
14. file://localhost/var/home/acumen/svn/trunk/engine/docs/working/4831/4831.html#_ftnref6
15. file://localhost/var/home/acumen/svn/trunk/engine/docs/working/4831/4831.html#_ftnref7
16. file://localhost/var/home/acumen/svn/trunk/engine/docs/working/4831/4831.html#_ftnref8
17. file://localhost/var/home/acumen/svn/trunk/engine/docs/working/4831/4831.html#_ftnref9
18. file://localhost/var/home/acumen/svn/trunk/engine/docs/working/4831/4831.html#_ftnref10
Hidden links:
19. http://www.coursework.info/
20. file://localhost/var/home/acumen/svn/trunk/engine/docs/working/4831/4831.html#_ftnref1
21. file://localhost/var/home/acumen/svn/trunk/engine/docs/working/4831/4831.html#_ftnref2