For a fair test I will keep these factors under control; these factors are the thickness of a wire, type of wire (density), temperature, and constant voltage through wire. I will control the thickness of the wire by using the same wire throughout the experiment, I will control the type of wire by also using the same wire throughout the experiment, I will control the temperature by track of the temperature throughout and if the temperature changes stop, I will control the amount of voltage by keeping the voltage of the power pack at a constant level throughout.
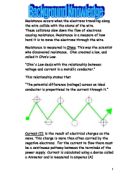
How the circuit should be set up
Equipment
- Battery (This will provide the voltage to my circuit)
- Multimeter (measure the amount of voltage and current flowing through the circuit)
- Analogue Ammeter (measure the amount of voltage flowing through the circuit)
- Different materials of wire, Nichrome, Constantan, tinned copper (Changing the wire length and type of wire in preliminary tests)
- Crocodile clips (Connect the wires to the components)
- Wires (connect the circuit)
- 100 cm ruler (Measure the length of wire)
- 50cm ruler (measuring smaller lengths of wire)
- Temperature gauge (checking for a constant temperature)
Preliminary tests
I have decided I am going to investigate the affect the length of a wire has on the resistance. Before I carry out my experiment I performed some preliminary tests, these were to determine what wire I was going to use, I also decided what type of measuring device I wanted to use, the Multimeter or analogue meter. I had already selected to use 10cm, 40cm, and 70cm interval length of wires for my preliminaries as I already had an idea of what would be suitable.
The first preliminary test I conducted was to see if a voltage of 5V would be suitable to show results from my experiment but not to burn my wires. From this result I also eliminated using the analogue ammeter; this is because I could not get a reliable reading as the needle kept flickering instead of giving an accurate reading. Instead I decided to use a multimeter. The Multimeter was easier to use and easier to collect data from. By using the multimeter I was able to guarantee results that were reliable, valid and consistent.
The next preliminary test that I conducted was to find out what type of wire I was going to use for my main test, the three wires I had to choose from were constantan, nichrome and tinned copper.
Here are the results from these tests
From these results I concluded that I would use constantan because I found the readings constant as well as being high enough to make good sized graphs with and this would make the results reliable and more presentable.
Main Test
Using the results from my preliminary test I have decided to use the constantan wire at intervals of 10cm ranging from 10cm to 70cm as this will make for a wide range of results on my graphs.
Method
- Set up the circuit as shown early in this investigation
- Cut the wire of constantan to 70cm and insert in circuit
- Set the power pack to 5V
- Turn circuit on and write down measurements of voltage and current readings
- repeat experiment 3 times on the same length of wire
- Cut off 10cm from wire and repeat steps 4-6 until have only 10cm left
Main Results
From the three tests that I had conducted I could see that the longest wire had the most resistance on all three of the tests, and this correlated with the smallest wire as this had the lowest resistance. Based on these results I have created graphs.
Conclusion
From analyzing my table I have found that the longer the length of the wire the higher the resistance there is preventing the flow of current; because of this there is a lower current, thus if the wire is smaller the resistance will be lower and the current will be higher. From the theory that I carried out for my investigation, I had predicted that as the length of the wire increases, the resistance is greater. My table and graphs verified this prediction as changing the length of the wire does change how much resistance is in each circuit and the current in the circuit. Something Interesting I found was that if I double the length of wire, this does not double the resistance or the current. For example, taking 10 cm which was a resistance of 0.825 ohms, then taking 20 cm, was 2.122 ohms, this shows quite clearly that doubling the length of the wire does not double the resistance. Looking at my graphs I can conclude that all my graphs have data that presents a nice curved line of best fit that flows through all the error bars; this presents for accurate data. Another observation I made was that there were no outliers in the data. I conducted the experiment three times and all the results are similar, this shows the reliability of the data.
Evaluation
I carried out 3 tests for voltage, and 3 tests for current, I cross referenced these results to work out the resistance of each length of wire. For each test there were 7 results as this would fit nicely on a graph. I believe 6 tests is a reasonable number to draw a strong and accurate conclusion.
The main reason why I believe my results are accurate is because I used accurate equipment that give a value to many decimal places, also when I performed this test I took into consideration the temperature of the room and this stayed constant throughout the experiment.
All my results fitted into a clear trend as they all showed that when the length of wire increases, the voltage increases and in turn made the current decrease as the length of wire increased. All my graphs also showed that as the length of the wire increased, the resistance increased.
At test 60cm of test 1 there was an error in the experiment as when I was carrying this one out somebody opened the window, therefore I had to wait till the temperature returned to what it was before to repeat this value and carry on with the experiment. The difference between the values was that the resistance was higher because the current was lower. The difference is irrelevant because I carried out this result again and got an appropriate and accurate answer.
My conclusion is representative of all my data as they all showed the same conclusion so I had to remove no results. I believe my results covered a wide enough range to give an accurate conclusion that is representative of most, if not all data. All of this data is reliable and accurate so I can say this is a firm conclusion.
Evaluating my method
I had no problems with my method, the equipment I used was chosen for accuracy so I knew my results would be representative. Throughout the experiment I controlled the other factors that can affect the investigation; I controlled temperature by using 28°C (room temperature) and carefully watching a temperature gauge throughout. Another factor I had to keep constant was voltage, therefore before each test I checked the voltage coming out of the battery box with my multimeter. To control the density of the wire I used the same wire throughout the main test. I feel my results were very accurate as I used instruments to give me results instead of judging by eye which would have been the problem with the ammeter. On my multimeter I used an appropriate scale division so the readings were adequate to the correct amount of decimal places.
Reliability of conclusion
To check my conclusion were totally correct, I cross-referenced my results with two other scientists.
Bibliography: