Now that the experiment is prepared, a pilot test can be carried out. In this pilot test the range of readings will be chosen along with which surfaces to choose from. Our range of masses was chosen to be from 0 – 1 kg with 8 readings on each of the three surfaces. A choice of five surfaces was offered and the three chosen were the ones that differentiated the most from each other. Very grainy sandpaper was supplied but during the pilot test it was found that as it the grains were so large, the lighter masses would just glide right over them.
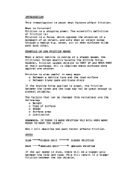
Friction is a force that tries to oppose motion. It is caused when two surfaces are in contact, by the roughness of the materials rubbing against each other, deformations in the materials, and a molecular attraction between materials. If looked through a microscope, friction on the molecular level is due to the unevenness of the surfaces. The two surfaces would have bumps, hills and valleys that would interfere with the sliding motion. If mass was to be added to these surfaces, the bumps and valleys would be pushed harder together, locking them tighter together making it harder to move them. This means that as more masses are added onto the block, the reading on the force meter will go up proportionally. Therefore if we plot a graph of the force on the force meter over the weight, a straight line through the origin should be obtained.
OBSERVATION:
After completing the experiment and having plotted the graphs, this is what was obtained and observed.
Tables of results:
P1 the first reading, P2 the second, P3 the third and Pav the mean of the three results: (P1+P2+P3)/3
DYNAMIC FRICTION
STATIC FRICTION
From these results, it was possible to plot a graph for each table, plotting Pav on the y axis and Weight on the x axis.
ANALYSIS:
From the results, it is visible that the force on the force meter increases as the weight of the block increases, therefore the heavier the object is, the more friction there is between the two surfaces.
The graphs plotted were the force of friction on the y axis and the weight on the x axis. This should have obtained a straight line through the origin and it did. Therefore, the friction between the two surfaces is directly proportional to the weight of the object.
Also, the static friction gradients are different from the dynamic friction gradients: dynamic - tiles 2/8= 0.25 (2sf)
- grey sandpaper 4.6/8.4= 0.55 (2sf)
- green sandpaper 4.8/7.6= 0.63 (2sf)
static - tiles 4/9.2= 0.43 (2sf)
-grey sandpaper 6.2/8= 0.78 (2sf)
-green sandpaper 7.6/8.8= 0.86 (2sf)
Overall, it seems that the static friction gradients are steeper than those of the dynamic friction. Therefore static friction is greater than dynamic friction, i.e. it is harder to get an object moving from an standstill position than it is to keep it moving.
The coefficient of friction is also useful upon analyzing this experiment. The static coefficient of friction concerns the force restricting the movement of an object that is stationary and the dynamic coefficient of friction concerns the force restricting the movement of an object that is moving (or sliding).
fr = Fr / W
coefficient of friction ; force of friction(force meter) ; weight
formula found at www.schoolforchampions.com
The coefficient of friction may be measured by calculating the gradient (as shown above) or by calculating it numerically. Instead of calculating the coefficient of friction for each reading, three were chosen at random to be calculated and the mean was made from those three.
Dynamic: tiles fr = 0.9/3.59 = 0.25 (2sf)
fr = 1.4/5.59 = 0.25 (2sf) } fr = 0.25
fr = 2.2/8.59 = 0.26 (2sf)
grey sandpaper fr = 1.9/3.59 = 0.53 (2sf)
fr = 3.2/5.59 = 0.57 (2sf) } fr = 0.55
fr = 4.8/8.59 = 0.56 (2sf)
green sandpaper fr = 2.3/3.59 = 0.64 (2sf)
fr = 3.5/5.59 = 0.63 (2sf) } fr = 0.64
fr = 5.5/8.59 = 0.64 (2sf)
Static: _ tiles fr = 1.4/3.59 = 0.39 (2sf)
fr = 2.3/5.59 = 0.41 (2sf) } fr = 0.43
fr = 4.1/8.59 = 0.48 (2sf)
grey sandpaper fr = 2.7/3.59 = 0.75 (2sf)
fr = 4.4/5.59 = 0.79 (2sf) } fr = 0.77
fr = 6.5/8.59 = 0.76 (2sf)
green sandpaper fr = 3.2/3.59 = 0.89 (2sf)
fr = 4.8/5.59 = 0.86 (2sf) } fr = 0.87
fr = 7.5/8.59 = 0.87 (2sf)
Calculating the coefficient of friction from the gradient is a more accurate way of measuring it because the gradient offers a much more accurate average than the mean of the results does as it is not affected by anomalous results.
From these results, it can be observed that for both static and dynamic friction readings, the tiles were the smoothest surface: they produced the least friction. The grey sandpaper produced more friction but the roughest surface was the green sandpaper whose coefficient of friction was the highest out of the three for both the dynamic and static experiments.
Also, the coefficient of friction was higher foe the static readings than for the dynamic readings. This can be explained by using Newton’s law of inertia. If the surfaces were looked at a molecular level, when stationary, the microscopic ‘teeth’ on the block will be interlocked with the hills and valleys in the sandpaper. A certain force is needed to dislodge the teeth and get the object moving, but a smaller force is needed to keep the object moving. This is due to the law of inertia: once these teeth get moving, they will climb the hills of the sandpaper but will not fall directly back down the other side; their momentum will propel them forward so that they may fly over some of the valleys. The difference between the static and dynamic forces is also due to the molecular attractions of the surfaces trying to hold them together. Once the bonds have been broken, less force is needed to keep the object moving.
EVALUATION:
The dynamic friction graph is quite accurate, the results all having similar relationships. All the lines of best fit pass through the origin and even though none have a perfect positive correlation, they all have a very good positive correlation. The static friction graph is also quite accurate but less so than the dynamic graph. All the lines of best fit pass through the origin, the worst results being on the tiles where the results do not accurately pass though the origin. This could have been due to the fact that with the instruments available, it was hard to measure exactly when the object moved, the instruments were also quite inaccurate especially the 10N force meter that only had 0.5N intervals. These slightly more inaccurate results might also have been due to the sandpaper being uneven or there being impurities on the tiles in certain places, making the block stick. The experiment was also less accurate because the person pulling the block might not be pulling it at constant speed, different people pulling the block (some have steadier hands than others), the block might have been sanded and smoothed as the experiment went on and the sandpaper might also have lost some of its graininess over time. Another cause for experimental error is the fact that friction generates heat and so some energy will be lost to the air by pulling the block along the surface.
In the experiment conducted, there were not any anomalous results obtained. But the result furthest from the line of best fit and therefore the most inaccurate was in the static friction graph. The point chosen was the final reading on the tiled surface (9.59N). The percentage of experimental; error can be calculated for this reading:
Difference between frictional force from gradient and frictional force from result
x100
Frictional force from gradient
= (4.57-4.2) / 4.2 x 100 = 8.81% (3sf)
This shows that there was not a large amount of experimental error.
Therefore, the evidence collected is good enough to prove the initial hypothesis to be correct.
The experiment could have been improved by using better more accurate instruments, having a machine pull the block at constant speed and by having the same machine pulling at the same speed each time. The experiment’s accuracy could also have been improved by making sure each time that the same surface of the block was being used and using different parts of the sandpaper for each repeat in case one part is rougher than the other.
Each reading was repeated twice which made the results more reliable; even so, a wider range of weights could have been used and use of more different surfaces would have been even better, making the results again more reliable.
Further experiments could be undertaken such as studying friction of an object on a slope. A wooden block will be placed onto a board. The block is massed beforehand. One end of the board will be raised slowly. As the slope increases, the block will not move until a certain angle is reached. When this angle is reached, the block will slide down the slope. This angle will then be recorded using a protractor. A mass will then be added to the block (the mass should be taped down to the block to prevent it from sliding off). The slope of the board will then be once more increased until the point where the block will slide off. Once again, the weight of the block + mass should be recorded in the table with the angle of the slope. This procedure will then be repeated using 6 more masses. A graph may then be plotted to demonstrate any relationship between the weight of the object and the slope at which it began to move. The graph plotted could be the angle of the slope at which the block moved over the weight of the block. Any extra tests will only increase the reliability of the Hypothesis.