Wire length in relation to Resistance investigation
Wire length in relation to Resistance investigation
PLANNING
Task
The aim of this investigation is to find out how the length of a piece of wire affects its resistance.
Prediction
I predict that as the length of the wire increases so will its resistance. This is because if the length of wire is doubled, the current (flow of electrons) will have to be pushed between twice as many atoms so the resistance should double as well. If we plot our results on a graph it should give a positive correlation if the resistance is directly proportional to length (as one increases so does the other).
Method and fair testing
The variable in the experiment that we are investigating is the length of wire. We will measure the voltage and current of the different lengths of wire at different voltages. We are going to test each length 4 times. We should get 4 slightly different resistance figures due to experimental error. For each length of wire, we will plot the current against the voltage and draw a straight line of best fit through these points. From previous work we have found that the formula for calculating resistance is:
Resistance (in ?) = voltage (in V)
current (in A)
The resistance should be the same for each voltage in the powerpack when the wire is the same length. However, due to human error it is possible it will not be the same for each voltage in the powerpack, so I will use a mean average of the four different voltages to work out the resistance for each length.
The resistance for each length of wire will therefore be represented by the gradient of each of these graphs. We chose to use this graphical method rather than taking a mathematical average so that any anomalous results will be obvious.
We will then plot resistance against the length of wire. Length will be plotted along the x-axis (bottom/horizontal) because it is the independent variable (it is the variable I choose to change). Resistance is plotted along the y-axis (side/vertical) because it is the dependant variable (its value depends on the length of wire chosen).
We will ...
This is a preview of the whole essay
The resistance for each length of wire will therefore be represented by the gradient of each of these graphs. We chose to use this graphical method rather than taking a mathematical average so that any anomalous results will be obvious.
We will then plot resistance against the length of wire. Length will be plotted along the x-axis (bottom/horizontal) because it is the independent variable (it is the variable I choose to change). Resistance is plotted along the y-axis (side/vertical) because it is the dependant variable (its value depends on the length of wire chosen).
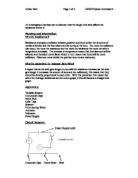
We will test each length, measuring the voltage and current, at 2, 4, 6 and 9 volts to give a range of results. This should make any anomalous results more obvious. To make this a fair test we will use the same apparatus throughout the experiment. We measure the resistance of the wire in 20cm intervals between 20cm and 100cm. We will use the same piece of wire for each of the readings and only change the place of the crocodile clips. The experiment will be done in the classroom therefore the wire will neutrally be at room temperature.
The equipment we will use is: a circuit board, an ammeter, a voltmeter, 100cm of wire, a power pack, 2 crocodile clips and wires.
Diagram
OBTAINING EVIDENCE
Results
Length
(cm)
Power pack voltage(V)
Measured voltage (V)
Current
(A)
20
2
.0
0.61
4
2.25
.22
6
3.5
2.07
9
5.75
3.11
40
2
.5
0.40
4
2.5
0.81
6
4.25
.31
9
6.5
2.06
60
2
.5
0.29
4
2.75
0.58
6
4.5
0.98
9
7
.49
80
2
.5
0.24
4
3
0.49
6
4.75
0.79
9
7
.16
00
2
.5
0.18
4
2.75
0.37
6
4.5
0.61
9
7.25
0.97
Length of wire
Resistance (??
20cm
.76
40cm
3.31
60cm
4.80
80cm
6.13
00cm
7.65
ANALYSIS
As you can see from our results table, we have found out that as we increased the length of wire, the resistance increased too. As the points lie in a straight line it also proves that the relationship is linear.
This is because the longer the wire is, the more atoms there are for the current to pass through, slowing down the flow of electrons. This means that the longer the wire, the more time it takes for the flow to pass through. Resistance is the force acting against the current therefore the longer the wire is, the higher its resistance. This has proved my prediction correct - as the length of the wire increases, so does its resistance.
We would have expected the resistance to be zero when the length of wire is zero but the results show a resistance of 0.4 ohms. We think that this is because the other components of the circuit (switch, voltmeter, ammeter, crocodile clips, and wires) have a resistance of approximately 0.4 ohms
The gradient of the length/resistance graph is 0.0765, which indicates that the wire has a resistance of 7.65 ohms per m.
EVALUATION
I am pleased with our experiment for it went well and proved my prediction correct. All or most of our results were very accurate because when a line of best fit was drawn onto the graph/s, it passed through or near to each plotted point and I cannot see any anomalous results. I feel that our results can be used as sufficient evidence to support the conclusion that resistance increases when the length of wire does.
To improve this experiment, we could monitor the temperature of the wire as during each reading the wire will probably have warmed up which might have affected the results. When something gets hot its atoms start to move around and the object expands. Because the atoms would be further apart this might reduce the resistance slightly. To prevent this from affecting any other readings, we could put the wire in cold water after each reading, to cool it, or do the experiment with the wire in water. The problem with doing the experiment with the wire in water is that the current may be conducted through the water if it is not pure/distilled. This is because a trace of acid or alkali in the solution could conduct the current and prevent it going through the wire giving a false reading.
To make our results more accurate we could take more readings by testing each length at other voltages (in addition to 2, 4, 6, and 9) and/or take readings of more lengths of wire.
To make the experiment more accurate, we could first substitute something of known resistance so that the resistance of the remainder of the circuit can be accurately calculated. This can then be deducted from the results to obtain the exact value of the resistance of the wire.
We could extend this enquiry by investigating whether the temperature of the wire affects its resistance and find the resistance of different metals.