Biology lab report
Aim: To study the effect of age on the reaction time.
Hypothesis: I think that the reaction time will increase as I begin to test older people. This is because as we get older, our muscles and organs get weaker and as the muscles (effectors) get weaker, they will need more time to react to a stimulus than the reaction time of younger people as they have stronger muscles (effectors) so they react normally to the stimulus, therefore needing less time to react to a change this is simply because the reflexes of a person are at their best when people are young (teenagers or 20s) so as we get older, our reflexes become worse. Therefore I think that the first age group (10-20) will score the best average reaction time, the second age group (20-30) will score the second best reaction time and the third age group (60 and above) will socre the worse for the reasons above.
Variables: 1. Independent: The ages of the people I test. I will have to vary the ages of the people I test as my aim is to measure the effect of age on reaction time.
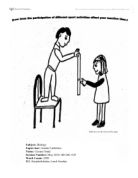
2. Dependent: The reaction time. I will measure the reaction time by seeing the point in which the person caught the 45 cm ruler in. Therefore indicating the reaction time by seeing if it increases (the person holds the ruler at a certain point, the reaction time increases when the point the person caught the ruler on decreases) or decreases (the person holds the ruler at a certain point, the reaction time decreases when the point the person caught the ruler in increases). The less the reading on the ruler at the catch point, the better the reaction time.