Apparatus Required:
Preparation
- Three test tube racks
- Twenty-Five test tubes
- One apple
- Cork Borer
- Ruler
- Knife
- Pipette
- Tile
Retrieving the Juice
- Filter Paper
- Another set of Twenty-Five test tubes
- Crucible set ( with a pestol)
- Twenty- Five cuvettes
- Three Stands
- Pipette
- Measuring Cylinder
- Colorimetre
-
Method
- Take one apple
-
Collect 25 cuvettes and 3 bases to use for colorimeter (5ml in each one)
- Then collect 25 test-tubes and three test tube rack
- Using a10ml measuring cylinder pour in 7 ml of sucrose solution (10%) ± 0.2ml into each test tube then label each with the appropriate temperature
- Remember there are 5 test tubes for each temperature
- The temperature of the water baths are as follows: 30°C, 40°C, 50°C, 60°C, 70°C ± 0.1°C.
- Measure the diameter of the cork borer (uncertainty should be 1mm)
- Place the apple on the tile and using a knife peel off some of the skin
- Use the cork borer to cut out a cylinder of the apple then use a ruler (uncertainty at ±1mm) and scalpel to cut cylinder into 25 discs of 5 mm in thickness.
- Place one disc into one test tube
- Ready the stop watches, and place them by each water bath
- After putting the test tubes into water baths, start the stop watches, wait and time for 17 minutes
- While waiting, ready 25 more test tubes, and put filter paper in each test tube
- After 17 minutes have passed, one by one decant the bathing liquid from each and every test tube into the crucible and crush the disc. After one disc has been crushed put it into the filter paper and wait for the solution to drip into the test tube. This should be completed for every sample for each temperature.
- Once a reasonable amount of solution is available (this may take some time) the next step can be undertaken
- Using a pipette and a measuring cylinder collect 5ml ± 0.2ml and pour the solution into the cuvettes. Remember to label cuvettes, so you are able to identify the sample number and the temperature this is very important as if the cuvettes are not labeled this will lead to inaccuracies.
- Then check for the absorbency and the transmittance. Remember to find the right wavelength for the solution for the best results and always remember to calibrate the colorimeter with a cuvette filled with distilled water before starting as this ensures accurate results. The wavelength used in this experiment was 430nm
- Draw up a table for the data in order to record your data (± 2 s.f.)
Justification of apparatus
Preparation
- 25 test tubes are needed as there are five temperatures and I need five sample, the same goes for the 25 cuvettes for the colorimeter
- The cork borer and ruler are used as they improve accuracy. Using them ensure that all the discs are of the same size.
- I do not need much solution and so using a small 10 ml measuring cylinder rather than a large one means a small uncertainty to deal with. Labels and stopwatches are also necessary and improve the accuracy as well.
Retrieving the Juice
- The colorimeter shows us the absorption percentage
- Filter paper is needed to remove solid bits of the solution
- The crucible is used instead of a blender as my discs were much too small to blend, crushing them using a crucible and pestol would be more efficient and work better. This way I was easily able to filter.
Data Collection and Processing
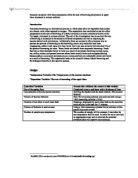
Qualitative data
Description of the physical state of the solution
From this we can derive that as the temperature increases, the colour of the solution becomes more yellow until the temperature of 50°C, however after this temperature the colour of the solution become slightly clear or in other words the yellowness of the solution starts to decrease.
Quantitative data
This table shows the percentage absorption of the 5 samples for each of the temperature measured using a colorimeter. The wavelength was 430nm as this the wavelength at this I would get the most accurate results.
The anomalies are highlighted in the colour red. The reason to the arrival of anomalies would most likely be that when the crushing of the disc was taking place, some crushed more than others, however the arrival of the identified anomalies are evaluated in more depth in the Conclusion and Evaluation. I have concluded these two results to be anomalies because though they are within the range of the data collected, they are not the expected results as they are slightly off. In general, the qualitative data correlates with quantitative data.
Mean of Temperatures calculated with anomalies
Calculation of Standard deviation
Where
S= Standard Deviation
= Each value in the sample
= Mean of all the Values
N= Number of Samples
Standard Deviation calculated with anomalies
The Graph for Average Percentage Absorption for Apple discs at each Temperature (with anomalies)
To calculate the error bars for standard deviation and use them in the graph below, we must do the following:
Apply standard deviation, using the follow formula:
s = series number I = point number in series s m = number of series for point y in chart n = number of points in each series yis = data value of series s and the Ith point ny = total number of data values in all series M = arithmetic mean.
The advantage of using such error bars is that because they show how the data are spread. Range error bars encompass the lowest and highest values. In this case, we shall be able to see whether a single result fits within the normal range. We shall also be able to make inferences from the data (i.e., to make a judgment whether the rate at different temperatures are significantly different, or whether the differences might just be due to random change or chance).
This graph shows the rate increased greatly from 40°C to 50°C and that this would the optimum temperature for the increase of the rate of browning as after this 50°C, the rate slowly starts to decrease but there is significant decrease in rate from 60°C to 70°C. The standard deviations here show that there is a large spread of data and shows us the difference between the estimated mean and the true value. Ninety-five percentage of the values lie with ± 0.02 of the Standard deviation and this is true for my graph. The temperature 60°C has the error bar of the shortest length and thus it has a standard deviation which means that the data points are considered close to the expected value. However the temperature 70°C seems to have the error of the longest length and thus has a high standard deviation which indicates a broad range of possible values relative to the expected value.
Mean of Temperature without anomalies
Standard Deviation without anomalies
The values in orange are values that have been reduced as an a result of excluding and ignoring the anomalies. They differ from the mean and standard deviation of the data that includes the anomalies.
The Graph for Average Percentage Absorption for Apple discs at each Temperature (without anomalies)
This graph shows that 50°C is the optimum temperature and beyond this temperature the rate of browning will no longer increase but in fact decrease just as the graph. This graph has been added as to the standard deviation and the error bars of data that excludes its anomalies. The length of all the errors bars are quite long and so this shows by excluding the anomalies A high standard deviation exists which indicates a broad range of possible values relative to the expected value.
Comparison between the Two Graphs
Surprisingly, the error bars for the data that excludes anomalies is much longer than the data that includes the anomalies. This is quite unexpected as unusual as one would assume the data that excludes the anomalies would have a low standard deviation and thus be more accurate and closer to true value (mean). However, the data that excludes anomalies seems to have a larger spread of data.
Conclusion and Evaluation
Comparison and Explanation of the Graph which shows the both the inclusion and exclusion of anomalies:
This graph alludes to us that, the standard deviation of the data that excluded the anomalies was higher than that included the anomalies. The mean of the data that excluded the anomalies was also higher, which meant the spread of data was larger than that of the data that included the anomalies.
Final Conclusion (with theory):
To conclude, I can reject my null hypothesis for it was not true and except my hypothesis, which is true to a certain extent as in my hypothesis I did not take into account the denaturation of the enzyme. According to my results, the enzyme denatured at 50°C as this was the optimum temperature at which the rate of browning had increased the most, after this temperature the rate decreased significantly meaning that the enzyme’s shape had change and could no longer function as it did not fit in the active site (lock and key).
Enzymes are globular proteins, which act as a catalyst in chemical reactions and their structure is very delicate and can be damaged by various substances and conditions. Denaturation is the changing of the structure of an enzyme, so that it no longer can carry out its function and this change is usually a permanent one.
The substrates bind to a special region on the surface of the enzyme called the active site. This active site, catalyses a chemical reaction involving substrates. Enzyme substrate specificity means most enzymes are specific, they catalyse only a few different reactions. There are only a small number of substrates. This means that if the enzyme denatures, then nothing can be replaced, the rate being measured shall decrease as the reaction can longer take place.
As the temperature was increased, a number of bonds in the protein molecule were weakened. As these bonds were weakened and broken, the protein obtained a more flexible structure. If heating had ceases before 40°C, the protein would have been able to readily refold to its original structure. As heating continued, some of the hydrogen bonds that stabilized helical structure were broken. As these bonds are broken, water can interact with and form new hydrogen bonds with the amide nitrogen and carbonyl oxygens of the peptide bonds. The presence of water further weakens nearby hydrogen bonds.
Additionally, as temperature increases beyond its optimum temperature, there are more collisions of particles due to an increase in kinetic energy provided (heat) within enzyme, and the speed of these collisions are extremely fast which also cause the enzyme to denature and change shape.
In all, temperature affects the rate of browning to an extent, as the rate does increase with the temperature but does denature and hence stops the increase. The temperature that this enzyme works best at is between 40°C -50°C. However my conclusion is not extremely strong due to my inaccuracies that occurred during the experiment and my distinct anomalies.
Structure of a Phenol enzyme
Word Count: 3,394 Words
fairfld61.files.wordpress.com/2010/08/bsaac1-6-enzymatic-browning.ppt
www.curriculumsupport.education.nsw.gov.au/.../apple_browning.pdf
http://www.food-info.net/uk/colour/enzymaticbrowning.htm