Conclusions and evaluations
By this investigation, I tried to find out the changes in potato cylinders’ masses dependently on sucrose solution outside and hence – concentration of sucrose inside the potato, which has the same water potential as solution outside the cylinder. The data from this investigation shows that there are different results for potato and sweet potato cylinders. Therefore, we know that water potential (and concentration of sucrose) inside the potato and sweet potato cells is different. On the other hand, in both, by increasing outside solution concentration, water potential was gradually increasing in the cell. Therefore, less water was diffusing into cell and more water out of it. That caused higher mass difference and higher percentage mass change in the potato cylinders.
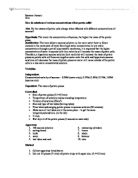
By using the graphs below, we can predict which concentration of solution has the same water potential as water inside the potato cells. However, results are not very precise (I’ll talk about that later) and it is hard to say accurate concentrations. The same water potential means no change in mass of potato cylinder. Any of my tested cylinders left the same as before. If we look at the trend line in the graph, we can find the most possible concentration.
- The same water potential as potato: 0.3 M sucrose
- The same water potential as sweet potato: 0.8 M sucrose
As I’ve already said before, my results are very not precise. I can say that because not all points are lying on the trade line. Therefore, I may do assumption, that there are a lot of errors in this investigation. First of all, we didn’t do any replications and that lowers this data’s confidence and reliability. The highest deviation, as we can see from the graphs, appeared in 0.4 M sucrose solution with both types of potato. If it had happened only with one of two types of potato, I would say that it’s possibly because of wrong measured mass. But now, there are mistakes in both types and therefore I think that the problem was in solution. I think that I put too little water or too much sucrose while making 0.4 M solution, thus water potential in it got lower and caused lower osmosis to potato. Therefore, mass after got lower than it should be and percentage difference in mass increased. It is random error because it caused changes only in one concentration, however – in both different types of potato.
One more thing, which could explain why all the points of percentage changes in masses are not correctly on the trend line, is wrong mass measuring. By saying “wrong mass measuring” I have in mind few possible errors:
- Potato cylinders weren’t fully drained. That increased potato mass and decreased percentage change in mass. This is clearly seen in 0.0 M and 0.6 M concentrations in both types of potato, less deviation – in 0.2 M. Also, from the graph we can see deviation possibly because of this error in 0.8 M, but it’s really low. I would say that this error is systematic because it appears in almost all concentrations and makes results lower than they should be.
- Because of high number of measured cylinders (6 of each type) it is possible that I put wrong potato to wrong concentration or just recorded mass differently than it is. That is less possible than first error because I tried to be as much concentrated as I can, but it could appear. This error, if it appeared, was random because I can’t see any vivid deviation to one side.
One more thing, which could explain not very precise data, is that potato cylinders weren’t perfectly the same. Although we tried to make all shape the same, maybe there appeared random error about shape and that influenced final results. Moreover, maybe there’s some hull left on some of potato cylinders. That made the osmosis slower by making a “barrier” for water. It didn’t stop it, but just made it slower and therefore changes in potato masses weren’t increasing perfectly gradually by increasing concentration of outside solution. This error is also random because it didn’t push the data to one the same direction.
Finally, it is very logic that my data is not very precise because living organisms can vary a lot and results depends on a lot of conditions. Therefore it’s not always objective to compare results with literature or other’s value. In this particular investigation, potato may were grown under the different circumstances, had different concentration of sucrose inside and different water potential.
I’ve mentioned quite a lot of errors, both systematic and random. That shows that this investigation wasn’t perfect and it can be improved a lot. First of all, as all investigations, this one requires a lot of attentiveness. On purpose to achieve better results, all the steps should be done very carefully, precisely. Especially, making solutions and measuring all masses. For being more precise in making solutions, it’s better to use the same size tube-pipes because now it was really hard to be sure that all the solutions are made right because volumes looked different. Moreover, it is very important to be sure about measuring right initial and final masses. I’m pretty sure that initial masses were measured correctly, unless there appeared random errors as just recording wrong digits. On the other hand, I think that there were errors in recording final mass. To eliminate these errors, it’s very important to make sure that while measuring final mass, there’s no additional water on potato cylinders, which could change final results (by decreasing percentage change in mass). Finally, as I have already mentioned before, almost all errors can be eliminated by just increasing level of meticulous in every step of investigation.