Analysis
Firstly the data will be given a Pearson correlation coefficient test to see whether there are correlations between the data obtained. In this test, if the number obtained from the test is 1, it means that there is a perfect correlation between the two data. However, if the number obtained from the test is 0 it means that there is no correlation at all. So the closer the number is to 1, the greater possibility that the height and shoe size are directly proportional.
Male = 0.701
Female = 0.597
The Pearson correlation coefficient test gave the results above. This shows that there were some sort of correlation for both male and female and from this test, it seems like that the male tend to have more correlation than female. So the Pearson correlation coefficient test does state, only to certain extent, that there are some sort of correlation between the shoe size and the height. But since the number is not 1 or very close to 1, we can not state and conclude that there is a correlation between the two data and more analysis is required.
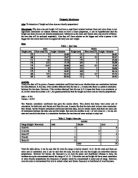
Table 2. Height / shoe size
From the table above, it can be seen that for male the range is mainly around 16~21 for the male and there are some sort of correlation and it can be said that for male, the shoe size and the height are somewhat directly proportional. However for female, the frequency is all over the place and distributed whereas in male, the numbers are quite concentrated around the range of 16~21. If the shoe size and height did have some correlation or were directly proportional the frequency of people would be concentrated in some sort of range. However, since the male is concentrated but only to certain extent and female frequency is distributed all over the place,
Graph for Male data
Graph for female data
As we can see by the graph, the male data(graph 1) shows some correlation and the data obtained suggests some sort of correlation but about one third of the people did not fit into the trend. This suggests that there are correlation but that correlation does not effect everyone and that not everyone fits into the correlation. In the female data(graph 2), about 4 people were out of the trend out of 9 people. This is approximately half the people and once again suggests that while there are correlation and relation between shoe size and height but does not affect everyone. Also as we can see from the trend line and the data, not everyone is in the proportion and the correlation between the shoe size and height is present but only to certain extent and not everyone fits into that correlation.
Conclusion
From analyzing the data it can be concluded that there is a correlation between shoe size and height and that they are directly proportional but only to certain extent and only to some people. From the graph it was seen that whilst some people fitted into the trend line perfectly, some people were out of the trend line by quite a far distance. So in conclusion, height and shoe size are directly proportional but only to some people. While some people were under the trend line, some people were above it. This suggests that while there are correlation between the two data, people are not restricted to it and variations may occur and people with same height may not have same shoe size and vice versa.