Variables
Independent: the concentration of sucrose solutions (0.0, 0.2, 0.4, 0.6, 0.8, and 1.0M)
Dependent: the length of potato piece
Controlled:
- Time to be in the solutions:
The longer potato is in the solution, the more osmosis takes place. That is, more water molecules could move either into or out of the cell in extra time.
The bigger potato would take more time for osmosis to take place as there are more water molecules and solutes at the same time.
- Shape of potato (size, length, thickness, etc.):
The surface area matters. If the surface is more exposed to the solution, the reaction would occur faster and vice versa.
- Way for potato to be placed in solution:
Regarding the surface area and the rate of reaction, all potato pieces should be fully soaked to make sure all the surface area to react.
- The amount of sucrose solutions:
More amount of solutions as one of reactants can cause the faster reaction in a given time.
Hypothesis
The solute concentration of potato cell should be one of six different concentrations. If the potato is put into a sucrose solution that has the same concentration as that of potato, the change in length and mass would not happen. This would be because on the basis of osmosis, two sides of semi-permeable membrane have the equal concentration and hence there is little movement of water molecules. If the concentration of sucrose solution is higher than that of potato cell, potato piece would shrink in mass and length as water molecules inside the potato would go out of potato cell to the solution with the higher solute concentration. In contrast, when potato piece has higher solute concentration, water molecules in sucrose solution move inside the potato, causing it to swell due to water uptake. Then, the potato would be longer and heavier. In short, to find out the solute concentration of potato cell, it is important to check whether the difference in length or mass is made after the reaction.
Materials
- each 20 mL of different concentrations of sucrose solutions (0.0, 0.2, 0.4, 0.6, 0.8, and 1.0M)
- a cork borer
- 6 x test tube
- test tube rack
- 6 x corks
- 6 x 100 mL measuring cylinder (± 1 mL)
- electronic balance (± 0.0005 g)
- 5 g of potato
- stopwatch
- a 30 cm ruler (± 0.1 cm)
- petri dish
- paper towel
- tweezer
- a chopping board
- scalpel
Method
- Cut potato into a shape of cylinder on a chopping board and using a cork borer and a scalpel.
- Measure the mass of a petri dish.
- Make sure the cylinder to have the mass of 0.7 g on the petri dish
- Ensure potato piece to have also the length of 3.5 cm using a 30 cm ruler.
- Repeat steps 1, 3, and 4 five times more.
- Measure 20 mL of six different concentrations of sucrose solutions (0.0, 0.2, 0.4, 0.6, 0.8, and 1.0M) using each 100 mL measuring cylinder.
- Pour them into each of six test tubes.
- Control is to put nothing but potato cylinder with 0.7g and 3.5 cm in a test tube as no treatment.
- Soak fully each potato piece into every beaker.
- Close each of the tops with a cork.
- Leave the set up for 25 minutes using a stopwatch.
- Take out the potatoes using a tweezer.
- Remove carefully the water on the surface using paper towel.
- Measure the final length of each potato using a 30 cm ruler.
- Record the difference between initial and final length of potato.
- If there is no much change of mass in certain concentration in the percentage, the concentration is that of potato cell.
- Repeat steps 1-16 four times more.
Result
Table 1: raw data for the final length of potato in different concentrations of sucrose solutions (0.0, 0.2, 0.4, 0.6, 0.8, and 1.0M) after 25 minute-reaction with the initial length of 3.5 cm
Note:
Li = initial len
gth of potato = 3.5 cm
Lf= final length of potato
Note: uncertainties are based on ± half of the place value of the last measured value, provided there is limit for the precision at both ends of the ruler.
Table 2: processed data with mean and standard deviation for the difference in length of the potato in different sucrose solution concentrations during 25 minutes
Sample calculation
-Mean
all the values
Mean = –––––––––––––––––––––
the number of the values
(0.1 + 0.5 + 0.0 + 0.5 + 0.2)
= ––––––––––––––––––––––––
5
= 0.3
Table 3: processed data for the difference in length of potato from the initial one in percentage (%)
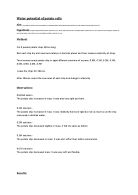
Observations (Qualitative data)
Above all, before potatoes are actually put into the test tubes, those which were left outside for a long time went through some brownish color change.
Secondly, almost as soon as the cylinders of potato pieces were put into the test tubes, first three potatoes in 0.0, 0.2, and 0.4 M of sucrose solutions sank to the bottom and the rest of t
hree potato pieces in 0.6, 0.8, and 1.0 M of that solutions floated.
Besides, visually it was seen that the potatoes shrunk and inflated in width and length. In the first three test tubes, potatoes got longer and bigger while in the last three ones, those became shorter and thiner.
Finally, when they were taken out, potatoes that had been in 0.0, 0.2, and 0.4 M of sucrose solutions were weaker and thus bended more unlike those from 0.6, 0.8, and 1.0 M of sucrose solutions.
Graph 1: the difference in the length of potato in different sucrose solutions from the initial length in percentage (%) during the period of 25 minutes
Note: error bars- standard deviation
Plus and minus one standard deviation that is calculated above is shown on each of the bars.
Conclusion
The results proves the hypothesis. In lower concentration of sucrose solution than the certain concentration of the solution, which is considered as the solute concentration of potato, the potato length has increased. In the higher concentration of the solution, on the other hand, potatoes showed the decrease in length. This is because highly concentrated sucrose solution represents the low amount of water molecules and hence potato with larger amount of water molecules gives its water molecules to the solution, being shrunk. As visually seen in Graph 1, the difference in length decreases with the increasing concentration of sucrose solution up to 0.4M. From 0.6M, the difference of length from the initial one starts to increase.
The certain solute concentration for potato cell can be inferred to be 0.4 mol dm-3 since in the 0.4M sucrose solution, there is 0% change in length despite 25 minutes long reaction as seen in Table 3 and Graph 1. The reason why 0% change implies the solute concentration of potato is that water molecules do not move inclining toward either direction in the case of the same concentration at both sides, hence creating no length change. In short, both sucrose solution and potato cell have 0.4 M concentration and thus do not cause any changes in any length or mass. It would be more clear to compare to control without the treatment of sucrose solution at all. Actually control can be deemed as the initial length (3.5 cm) of potato. Therefore, potato from 0.4M that still has the same length after the reaction as controlled potato definitely indicates this.
This is all about the process called osmosis, which is special type of diffusion. Diffusion and osmosis are the natural phenomenon in which molecules wants to be spread evenly throughout the space and reach the state of equilibrium (Diffusion and Osmosis, n.d.). Therefore, more water molecules want to flow to the high solute concentration with low amount of water molecules to reach an equilibrium of evenly-spread water and solute molecules.
Overall seeing the mean and percentage change, it is considered good result. Despite the variation always accompanying to living organisms, the standard deviations are very low in that all trials have 0.2 cm except for one trial with even lower 0.1 cm. Error bars are also small because they are based on low standard deviation. These lead to high precision for this data.
Evaluation
Still these experiments involve a number of sources of errors. Human errors are always present as they can not be reduced to zero. What is all the time problematic is to read the measurement. When all the 20 mL of six different sucrose solutions were placed in test tubes, they all seems various in amount; the height was different from another. This error goes with the uncertainties of measuring equipment. By the way, the uncertainties of 100 mL measuring cylinder is ± 1 mL. Actually this much of uncertainties can have great effect as in maximum 2 mL less amount of sucrose solution, the osmosis reaction can not occur as well as in 2 mL more of sucrose solution, then causing little change in length to make it hard to compare.
Another human error in the act of measuring is that six potato pieces were not placed into the test tubes at the same time and so were they when taken out from test tubes. The longer potatoes were sunk in the solution, they would go through more movement of water molecules and thus either more increase or decrease in length depending on the difference between the concentration of sucrose and potato cell. As it was true that it took so much time to take out the potato especially that was sunk to the bottom, this error could have large effect on the data.
The other error can be considered as human error and systematic error. This was to use the same measuring cylinder when measuring 20 mL of different concentration of sucrose solutions in an actual experiment. In spite of little amount that was left in the measuring cylinder, this could make the solution not exactly concentrated. Some could dilute and some could strengthen. Thus, it could have make the boundary between different concentrations unclear. For example, in one of trials the concentrations might be 0.1, 0.2, 0.3, 0.6, 0.6, and 1.2 M. This is greatly influential in that the differently concentrated solutions are independent variables with some pattern. This could have caused the confusion in the comparison both to control and among the concentrations.
The last source of error can be browning of potato as mentioned in qualitative data. The process of browning is because of brown pigments. In enzymatic browning, the enzyme called polyphenol oxidase catalyzes the oxidation of phenols in potato and forms quinones (What causes browning of foods?, 1999). Then these polymerize, forming melanin. It is melanin that causes the brown pigments. This situation seems to have no great effect on this experiment. Though the brown color is likely to mean less fresh state, the freshness would not affect the osmosis process of water molecules. Even so, potatoes were all together browned. This would still make the comparison clear, then.
Seeing the standard deviation of 0.2 cm, the precision can be thought high. All five trials displayed very close result to each other. And five trials were many enough at least for calculating standard deviation. Although the result is whether accurate or not by comparing to known values, this data is still relatively reliable due to high precision and many replicates.
However, time management was comparatively poor. Actually, 25 minutes was too short for the osmosis to take place completely to the equilibrium state. The longer the set up is left, the better the result and the easier and clearer the comparison and difference would be. Yet, it is still fine since nevertheless the result is clear and easy to compare.
What improves this experiment is following. For better or improved reading on measurement and reduced uncertainties, a pipette can be useful. It seems good to see if the height and hence the amount of sucrose solutions in test tubes is kept equal to each other by dropping one or two drops.
For maintaing the same time for potatoes to be put, reacted, and taken out, it can be an idea to get help from other persons. Another solution is to divide six test tubes to three sets so that one person can manage all starting stopwatch, closing corks, and putting pieces. What should be careful here is to keep the time same for every time.
To avoid the third error is easy but just time consuming. The solution is to use separate 100 mL measuring cylinder every time when pouring different concentrations of sucrose solution. Though the solution is simple, the effect would be great, allowing more exact changes in length.
In terms of browning of potatoes, it can be solved if potato is cut when everything is set up and what is left is to put potatoes as cutting them in advance was the problem. Yet, time to make sure the same mass and length is inevitable.
Finally for better reaction to occur, time should be longer as said before. Though taking a lot of equipments, it can be considered to set up at least three trials simultaneously. It can save time of waiting and allow more than five trials.
Bibliography (Reference list)
-
Clegg, C. (2007). Biology for the IB DIPLOMA. London: Hodder Murray.
-
Diffusion and Osmosis. (n.d.) Retrieved June 19, 2010, from
-
What causes browning of foods?. (1999). Retrieved June 20, 2010, from