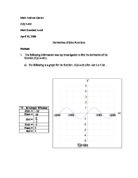
The function,, when graphed on the TI-83+ Calculator with the following correct [WINDOWS] settings will produce a graph with a domain of a range of
To access the [WINDOWS], simply press [WINDOW] underneath the screen.
After doing so, change the [WINDOW] to match the above image by doing the following:
Enter:
-2for Xmin=
2 for Xmax=
/2 for Xscl=
-2 for Ymin=
2 for Ymax=
1 for Yscl=
After doing the above tasks the correct graph will be produced by pressing [GRAPH].
In the above given domain of , the gradient, otherwise known as the slope of the function, has a distinct pattern. Beginning at -2 the function’s gradient is increasing positively until it reaches its maximum amplitude of 1, after a period of /2, or at -/2. Then from -/2 to 0, the gradient decreases negatively until it reaches -1 for its minimum amplitude. Later on starting at 0, the gradient begins to once again moves upwards positively until it reaches a maximum amplitude of 1 at =/2 or at positive /2. The graph then continues from /2 by moving negatively downwards until it reach minimum amplitude of -1 once again at 2. The pattern then repeats the period from 0 to 2 continuously for infinity. The graph also has x-intercepts at every interval of n.
The derivative of the function, are the limits of the slopes of the numerous tangent lines that passes the original function. Therefore a limits proof will be made to determine the derivative of the function.
We will first begin with the general formula used to determine the limits or the derivative of a function.
Since, then we replace it with , then it becomes,
Since is like the addition identity we replace it with and expand , the limits then becomes:
We then lose the brackets and the function becomes:
From here group like terms and simplify the equation to produce:
Then we separate the limits to create:
We then bring down the and to the sides to produce:
we then multiply by its reciprocal and FOIL the terms to create:
Since therefore this will then produce the limit:
Since therefore which will create in turn:
We then factor out in order to create to create to following limit function
Which in turn wil allow us to factor out the entire limit function to create:
Once again since therefore and is able to be reduced to by substituting 0 in for h, which will create the following limits formula:
When simplified will become:
Therefore the derivative which is also called “differential quotient”, is a function that is derived from an original function, which can create the instantaneous rate of change at any given point on the original function.
Therefore the derivative of the function is.
To prove that the above conjecture, that the derivative of the function is, we will also solve for the derivative graphically as well. The derivative is defined as the slope at the point, and therefore where the derivative is based solely on the slope or the gradient of the original function of. The slope for the function of at 0, or in other words, when the tangent line remains horizontal on the graph; which are the respective maximum and minimum points, the derivative of sine is at 0 for its f (x) value in (x, f (x)).
We can note the slope of is at 0 when the function reaches its maximum and minimum amplitude which means that the derivative of is equal to 0 at these points which are. Using this information, we can plot the points in which x-intercepts of the derivative of is. To determine the rest of the points in which the rest of the derived function lays on the graph we use the [nDeriv] function found in the TI-83+ Calculator.
To use the [nDeriv] function we first enter the [MATH] and then scroll down using the Cursor keys to select [8: nDeriv]
The steps required to successfully execute the [nDeriv] function is:
- Equation of the Function
-
Designate the variable, in this case X
- The value for X
Your screen should then look like the following:
After that, you press [ENTER] and receive the following answer to the [nDeriv] function, which is approximately equal to the answer of
We can also use the [nDeriv] function to display the graph of the derivative of .
To do so we first enter the [Y=] menu, and for [Y1=] we type: sin(x), for [Y2} we type: nDeriv(sin(x), x, x), and also we make the [Y2] to display a thicker line in order to be able to distinguish the two graphs from one another.
To correctly display the graph we also change our windows to the following, after doing so the graph would look like so:
To correctly display the right window follow the following instructions:
Enter:
-2for Xmin=
2 for Xmax=
/2 for Xscl=
-2 for Ymin=
2 for Ymax=
1 for Yscl=
The thin line is the graph of the function displayed, and the thicker line is the graph of the derivative of the function which is nDeriv(sin(x), x, x) or otherwise known as .
To prove the conjecture is also true numerically we can also find the slope of the original sine function using tangent lines. This will allow us to find the slope of the sine function and also the y-value of the derived function at the point (x, f (x)). To do so we use the computer generated grapher, Advance Grapher.
To begin we graph the original function,with the same windows as the calculator, and follow the steps described below:
- Select the [Calculus] menu and click on [Tangent or Normal…]
- A popup will appear called “Tangent and Normal”
- In the drop down menu select Y(x)=sin(x)
- After doing so, type in the value -3.141592654 as the value for x, n the box labeled “Point to find Tangent/Normal”
- Click on [OK]
- A line will now appear on the sine graph, this is the tangent line
-
Repeat the last six steps for values of -6.283185307, -4.71238898, -3.141592654, -1.570796327, 0, 1.570796327, 3.141592654, 4.71238898, and 6.283185307. These are decimal forms of the following radians:-2, -3/2, -, -/2, 0, /2, ,3/2, 2.
The above steps will draw tangent lines at selected coordinates in order to find the slope of the sine function at the chosen points. The x and y values are used to draw the tangent and to find the slopes in order to confirm the points of the derivative. After the tangents lines are drawn the equation are given at the left hand side of the screen.
We can then compare the gradient of the original function in comparison to the location of the derivative of sine in the table below, using the tangent line to find the slopes at given points in Graphmatica:
After verifying that the slope of the original function does equal to the y-value of the derivative at a given point (x, f (x)), we can make a second conjecture:
Conjecture:
“If the slope is a given number of the tangent line for the function , then it will equal at the given point (x, f (x)) as the y-value.”
We can now confirm that the derivative of sine is cosine, as the properties and given ordered points match.