VARIABLES:
Independent Variables:
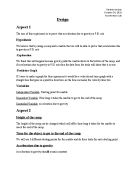
- The height from which the ball was dropped.
Dependent Variables:
- The time taken for the ball to drop
Controlled Variables:
- Metal Bob – The same metal bob was used for all trials at all heights.
- Reaction time – One member of the group was responsible for timing all the trials so that delays due to his reaction time negate each other.
- The measuring tape – The same measuring tape was used to measure all heights.
PROCEDURE:
The metal bob was dropped from heights of 9.0cm, 17.0cm, 25.0cm, 33.0cm and 41.0cm. The time taken for the bob to cover the distance was measured using a microphone attached to a CRO that produced a voltage spike as soon as the ball dropped producing a sound that was picked up by the microphone.
Safety Precautions:
- Covered shoes were worn so that accidentally dropping the bob would not hurt our feet.
- Since the bobs bounced high, it was ensured that any fragile item in the vicinity was taken care of.
RAW DATA COLLECTION:
Four readings were taken for each of the height from which the ball was dropped. The raw data collected is tabulated below:
Table 1: Raw Data: Time taken for metal bob to drop from each height
Uncertainties:
-
Uncertainty in the Height (H) = = ±0.1cm.
-
Uncertainty in the Time taken = Uncertainty in instrument = ±0.0001s.
Using a spreadsheet, the average time taken was calculated and are displayed in the table below:
Table 2: Processed Data: Average time taken for metal bob to drop from each height.
Uncertainties:
-
Uncertainty in Time TakenAverage = Random error =
Sample calculation for 1st set of data (H = 9.0cm):
±0.0002s. Note: The higher of the random error and the instrumental error is taken. In case of the 3rd set of data, random error = instrumental error. Thus, uncertainty can be any.
To find the value of g, the value of t2 is calculated using a spreadsheet and is displayed in the table below:
Table 2: Processed Data: Square of the average time taken for metal bob to drop from each height.
Uncertainties:
-
Sample calculation for the 1st set of data:
-
(0.1352 ± 0.0002)2 = (0.1352 ± 0.15%)2
-
(0.018279 ± 0.30%) = 0.018279 ± 0.000055
Since the height H is directly proportional to the value of (TAvg)2, a graph is plotted below, using a spreadsheet’s ‘scatter plot’ function:
From graph 1, it can be deduced,
H =
Uncertainty in final value obtained:
Total Error =
Random Error be calculated using graphical techniques as follows:
Random Error.
Therefore, Random error.
OR 2.05%
Therefore, the acceleration due to gravity on Earth, as obtained from this experiment = 9.74±0.05 m/s2.
CONCLUSION AND EVALUATION:
As it can be seen from the total uncertainty calculation, the experimentally deduced value for the acceleration due to gravity on Earth is accurate to a large extent. In fact, the literature value of 9.81m/s2 is extremely close to highest end of the range of experimental data—9.69m/s2 to 9.79m/s2. The difference between 9.81m/s2 and 9.79m/s2 is understandable but excusable.
The r2 value for the line of best fit is 0.9999 which shows excellent correlation between the value of H and t2. This confirms the fact that acceleration does not change and always remains a constant 9.81m/s2 on the surface of Earth. The error bars exist on the graph but they are not so prominent because the absolute errors are very insignificant. However, for the fourth value, the uncertainty is comparatively larger and hence, the distance between the three gradient lines are considerably legible.
The uncertainty, however small cannot be ignored and it must be explored so that if possible, it can be avoided in the future. Firstly, the recording of the height was not done with a very precise ruler. A lot of time and effort was spent to ensure its accuracy in the readings and not let its faults hinder the experimental results. This is could be avoided if a more precise ruler or instrument to measure height could be present. Secondly, although the voltage spike generator (CRO) was undeniably accurate, no information about any time delays in the microphone was known. The possibility of microphone causing a significant lag, in spite of the ball falling close to it is very improbable but nonetheless, it exists.
The effects of air resistance were ignored because of their very ignorable influence on the readings. The mild influence on the readings in this experiment might partially be owed to the effect of air resistance. Perhaps, a more aerodynamic object could be used but investing in those are not worth unless the major sources of systematic error such as the imprecise ruler and the doubtful microphone are replaced with reliable, accurate and precise instrument.
Ultimately, this experiment serves to remind us of the experimental nature of Physics and in the course of this experiment, many doubts were cleared with regard to instruments and techniques.