World Energy resources
Fossil Fuels Introduction: Fossil fuels are non-renewable energy sources that formed more than 300 million years ago. Fossil fuels are made up of plant and animal matter. When plants and animals died, their bodies decomposed and were buried under layers of earth. Millions of years later we have the three forms of fossil fuel: oil, natural gas and coal. A form of non-renewable source. Uses of fossil fuels: Fossil fuels are burnt to release energy in the form of heat. This energy can be used to power cars, produce electricity, heat homes, cook food etc. The procedure for the conversion of the fossil fuels to electricity. First, the fuel (whether it's coal, oil, or gas) is burned in a furnace at very high temperatures. The furnace then superheats water into steam. The steam creates enormous amounts of pressure which is used to rotate a turbine, (which is like a set of very tightly packed fan blades on a shaft). The steam rushing past the fan blades causes the shaft to rotate very quickly. The rotor of the generator is attached to the shaft, which then produce electrical power (flow of electrons). The following steps show how the fossil fuels are used to produce electricity: Note: The Oil and Gas can be burnt directly but the coal is first crushed to a fine dust and then burned. Advantages Disadvantages Relatively cheap Will run out High energy density or
Magnetic field around a conductor
IB Tingvallagymnasiet Karlstad Physics Department Fredrik Hansen Mail: [email protected] Laboratory experiment: Magnetic Field around a Conductor IB Physics Higher Level laboratory experiment report by Fredrik Hansen class: IB1A supervisor: Anna Malmberg conducted: 2009-05-29 written: 2009-07-27 Contents Introduction 2 Symbols 2 Aim 2 Research question 2 Independent variable 3 Dependent variable 3 Controlled variables 3 Hypothesis 3 List of material 3 Preparation 3 Method 3 Analysis 4 Conclusion 6 Evaluation 9 Introduction A conductor induces a magnetic field around itself while carrying a current. This magnetic field has the same properties as normal magnetic field in all aspects except that the field is oriented in a closed circle around the conductor following the right hand rule. Symbols In this experiment following symbols are used: B = magnetic field [T] I = current [A] V = voltage [V] R = resistance [?] r = radius [m] µ0 = permeability of free space (constant) [4?*10-7 TmA-1] Aim The scientist is supposed to investigate the relationship between current and magnetic field in a conductor by running a varying current through a circuit and measure the magnetic field induced by it. Furthermore the practical skills in the subject of the magnetism and electrical currents should improve. Research question How is the magnetic field
Physics IA - DCP CE - Resistance vs cross-section area
Investigating the relationship between resistance and cross-sectional areas Research: The aim of this experiment is to investigate the relationship between resistance and different cross-sectional areas of constantan wires. This is done by setting up a circuit that consists of a constantan wire, Voltmeter, Ammeter and a power supply. The cross-sectional area is found by measuring the diameter of constantan wires of different thicknesses by using a micrometer thereby using the formula: A=? (1/2d). The resistance is found by using the readings of the potential difference and the current on the Voltmeter and Ammeter respectively, using the formula: R = V/I Raw Data Table Constantan Wire # Diameter 1, D1, mm ?D1=± 0.01mm Diameter 2, D2, mm ?D2=± 0.01mm Diameter 3, D3, mm ?D3=± 0.01mm Average Diameter, Dav, mm ?Dav=± 0.01mm 26 0.40 0.39 0.40 0.40 28 0.36 0.36 0.36 0.36 30 0.30 0.30 0.30 0.30 32 0.26 0.27 0.26 0.26 34 0.22 0.22 0.22 0.22 36 0.17 0.17 0.18 0.17 Raw Data: The uncertainties for the Diameters were arrived from the smallest reading on the micrometer screw gauge. I think it is reasonable to neglect them since the micrometer is fairly accurate and the numbers are pretty small. . As seen from the graph, the relationship between my independent and dependent quantities is linear and they are inversely proportional. This
Bouncing balls
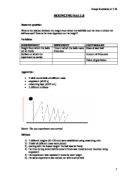
BOUNCING BALLS Research question: What is the relation between the height from which the ball falls and the time in which the ball bounces? How is the time dependent on the height? Variables: INDEPENDENT DEPENDENT CONTROLLED Height from which the balls are let freely Time in which the balls make 6 bounces Mass of each ball Surface on which the experiment is carried Amount of 6 bounces Value of gravitation Apparatus: * 2 table tennis balls of different mass * stopwatch [±0.05 s] * measuring tape [±0.05 cm] * 2 different surfaces Sketch: The way experiment was carried Method: ) 7 different heights (45-130 cm) were established using measuring ruler 2) 2 balls of different mass were picked 3) starting with the lowest height. the ball was let freely 4) the time during which ball bounced 6 times was measured and recorded using stopwatch 5) the experiment was repeated 3 times for each height 6) the same experiment was carried out with another ball DCP: I divided this experiment into 2 phases: the first one, original, was using floor as the surface on which the experiment was carried. The second phase was invented to reduce the uncertainties and make the experiment more reliable, precise and accurate. For the first phase of the experiment. I chose floor as the surface on which the ball was bouncing and the measurements were recorded. Table 1:
Stifness of Steel Lab
Variables: Independent: Length of blade (m) Dependant: Time taken for 1 oscillation (s) Controlled: - Mass of the magnets (One pair of magnets weighing 59.08g was used throughout the experiment) - Place of Release (Using tape, it was marked where the blade would be released from) - Type of Hacksaw Blade (One blade was used throughout the experiment) - Number of Oscillations (5 Oscillations timed for each trial) Data Collection: Table 1-Constant Values Mass of Magnet 59.08g±0.01 0.05908kg±0.00001 Thickness of Blade 0.77mm±0.05 0.00077m±0.00005 Depth of Blade 0.65cm±0.05 0.0065m±0.00005 * For the mass, an uncertainty of0.01g was used, as the uncertainty was stated on the weighing machine. * For the thickness and depth, an uncertainty of0.05mm was used, as the uncertainty was stated on the micrometer. Table 2-Average Time for 5 Oscillations Number of Oscillations Distance from Clamp (m) Uncertainty (m) ± Trial 1 (s) Trial 2 (s) Trial 3 (s) Trial 4 (s) Trial 5 (s) Average (s) Uncertainty (s) ± 5 0.1620 0.0005 .28 .37 .31 .40 .22 .32 0.04 5 0.2080 0.0005 .66 .78 .81 .66 .69 .72 0.03 5 0.2240 0.0005 2.47 2.16 2.19 2.38 2.20 2.28 0.06 5 0.2420 0.0005 2.53 2.65 2.60 2.75 2.66 2.64 0.04 5 0.2710 0.0005 3.28 3.22 3.13 3.42 3.22 3.25 0.06 * For the distance from the clamp, an uncertainty of 0.0005m
Determining how the height of release affects the velocity of a basketball
Determining how the height of release affects the velocity of a basketball Introduction: Velocity can be measured by the formulae of displacement over time. In this experiment we shall see how different heights of release for a basketball, can affect velocity. Aim: This experiment is directed in the process of discovering how the changes in the variable of height can have an effect on the velocity of a basketball. Apparatus: * 1 Basketball * 1 Tape ruler * 2 Stop-watches * 1 hard flat surfaced object * Writing instruments Variables Independent Variable: Is the height from which the ball is released. We shall perform the experiment in this order of 4 measurements: 30, 60, 90, 120 and 150 cm's. Dependent Variable: is relied upon changes from the independent variable, and therefore we can identify it as time. The time it takes for the basketball to hit the ground after release, will change due to changes in the height. Controlled Variable: - The same person releasing the ball - Air pressure and wind in the room, so it doesn't affect the aerodynamics - The angle from which the ball is released - The basketball: so the mass and dynamics of the ball are the same - The same person calculating time with the stopwatch Method . On a straight wall, use the tape ruler, to mark the following heights of release: 30, 60, 90, 120, 150 cm's with a marker. 2. Get a
Determining acceleration of free fall by of a simple pendulum.
Determining acceleration of free fall by of a simple pendulum. Introduction In this investigation I am going to use the simple pendulum to determine the value of acceleration of free fall. The method involves setting pendulums of certain lengths in motion and timing the time taken for ten complete oscillations at that length. Then using the formula T = 2? V (l/g) Therefore T2 = 4?2l g I aim to find the value of acceleration of free fall from the gradient of a graph of T2against l. From the above equation I hope to get a straight line graph with a positive gradient passing through the origin. As I hope to get a straight line graph the equation of the line will be in the form of y = mx + c But since the graph will pass through the origin my c = 0 If the above formula is then re-arranged as follows T2 = 4?2 l g but T2 = gradient for the graph of T2against l l Therefore it follows that gradient = 4?2 g Thus the acceleration of free fall (g) will be given by the equation below g = 4?2__ gradient My variables are length of pendulum (l), time for oscillations (T), height from which pendulum is displaced and number of oscillations. My dependent variable is the time T for the oscillations as it depends on the pendulum length which is the independent variable. The number of oscillations and the height from which the pendulum is displaced are
Pendulum Lab
IB HL Chemistry (Surface Area and the Period of a Pendulum) Submitted to: Ms. Fronczak Submitted by: Raphael Hanna Date: February 17, 2009 Course: SCH3UC Design Question: How will varying the surface area of the bob affect the period of a pendulum? Independent and Dependant Variables: The surface area of the bob was varied by melting chocolate into different shaped blocks with the same volume. The resulting effect on the period of the pendulum was measured. The independent variable in the experiment was the surface area of the chocolate blocks and the dependant variable was the period of the pendulum. Controlled Variables: The purpose of this experiment was to determine the effect of surface area on the period of a pendulum. This was does by varying the surface area of several blocks of chocolate and then measuring the period of the pendulum. Several variables however, can alter the results of this experiment. Controlled variables: Pivot point- The type of pivot point could affect how the pendulum swings by increasing the friction and changing the velocity of the pendulum. In this experiment the type of pivot point was kept constant throughout the experiment Length of the string- The length of the string will vary the arc on the pendulum and the period as a result will change. Using a ruler for increased accuracy the string length was kept as consistent as
investigate how the length factor of a pendulum string will affect the time period of a pendulum and to attempt and determine a mathematical relationship between the two.
Nilesh Jindal Physics SL The Simple Pendulum Lab Research Question: To investigate how the length factor of a pendulum string will affect the time period of a pendulum and to attempt and determine a mathematical relationship between the two. Hypothesis: A pendulum is made up of a mass (bob) attached to a string that is fastened so that the pendulum can swing (oscillate) in a plane. In a simple pendulum, all the mass is considered to be concentrated at a single point at the centre of the bob. Physical quantities of the pendulum include length L, mass m, angle through which the pendulum swings ?, and the period T of the pendulum (which is the time it takes for the pendulum to swing through one complete oscillation). I am choosing to study the length L of the pendulum because past experience and preliminary investigation lead me to believe that the period of the pendulum should have a direct relationship with the length. From a Physics book, I have obtained the following theoretical expression for the period of a simple pendulum swinging in a plane: Where g is the acceleration due to gravity and the terms in the bracket are an infinite series. To find T for a given angle ?, the more terms you use, the greater the accuracy of the theoretical expression. That being said, for angles relatively small, it is sufficient enough to use the standard formula for the time
The purpose of this lab is to examine impact craters. Impact craters occur when a high velocity object collides with a larger body
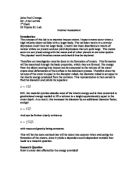
John Paul Chunga Mr. Arce-Larreta st Black IB Physics SL Lab Internal Assessment Introduction The purpose of this lab is to examine impact craters. Impact craters occur when a high velocity object collides with a larger body. The collision results in a circular depression crater into the larger body. Craters like these described are results of meteor strikes on planets and can yield depressions that are quite large. The craters occur on our planet along with the moon and all other planets in our solar system. The physical world involves craters and should thus be explored. Therefore an investigation must be done in the formation of craters. This formation will be examined through the basic properties, which they are formed. The energy from the object coming into impact can be compared to the volume of the crater create since deformation of the surface is the dominant process. Therefore since the volume of the crater is equal to the diameter cubed, the diameter cubed is set equal to the kinetic energy produced from the collision. This representation is then solved to find the diameter and yields the equation: Still, the material ejection absorbs most of the kinetic energy and is thus converted to gravitational energy needed to lift a volume to a height approximately equal to the crater depth. As a result, this increases the diameter by an additional diameter factor,


