It is predicted that with statistical analysis results will find that as the group size increases the proportion of the group looking will decrease and more time will be spent by the birds doing other confounding activities.
Method
We walked along the River Tyne roughly in 10 metre blocks stopping every 10 metres. Each group studied 10 groups of gulls of varying sizes. Each observation was taken by noting the date, time and tide. The distance of the length of the group was roughly calculated as the furthest distance between two birds in that group. Estimations were then made of how many birds were visible to any bird in that group this included both birds in the same group any others in the area not included in the group and any birds in flight. The behaviour of each bird in the group was then noted by scanning the group from left to right and instantly recording the behaviour. This was repeated to the same group about 5-10 times, starting from the beginning again as soon as the previous scan was completed. We tended to use less repetitions for larger groups and10 repetitions for smaller groups. Data collection was stopped several times as the group size changed, new birds arrived and birds left. Data collection was also stopped if there was an obvious disturbance among the birds (e.g. if a dog was near them). When data collection was complete the means for each of the type of behaviour for each group was calculated. This left one line of mean values for each group and these were added to the class data resulting in 416 sets of data which make up the results.
Results
All the graphs and table used in this results section consists of the sample size of 416 pieces of data.
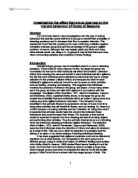
Figure 1: The percent of the group looking and being vigilant plotted against the group size in order to determine if they have a linear relationship. The graph could be interpreted as slightly linear but there is far too much variation to be certain. As the group size increases the percentage being vigilant decreases and the smaller the group the higher the percentage looking. In fact, from this graph the data looks to be approximately normally distributed.
Figure 2: This is the same graph but the points have been recalculated using the LOWESS (LOcally WEighted Scatterplot Smoother) function on Minitab. This function calculates new smoothed y-values for each x-value and joins them together. This makes it easier to determine and conclude that there is a linear relationship between these two groups of data. The linear relationship is made much clearer than the original scatterplot in figure 1.
Figure 3: The data plotted in figures 1 and 2 were linearly related. But the logs were taken of the data and plotted in this graph in order to create more of a linear relationship and to decrease the variance. The variance has decreased slightly but the graph does not seem any more linear than before. There only seems to be a cluster of points now with no real relationship.
Figure 4: Again, the same graph as figure 3, however the LOWESS has been calculated. Although it is linear it is a slight curve. Taking the logs has not made the points any more linear but it has decreased the variance slightly. And therefore does fulfil the regression analysis requirements.
Figure 5: This graph seems to be random. On first look there does not seem to be any sort of relationship between the total number of birds and the percentage being vigilant.
Figure 6: As the data in figure 5 seems to be random the LOWESS was calculated again and it appears there is a relationship, and it is linear. It seems that the line is on a slight gradient and that the higher the total number of birds the lower the percentage looking, and vice versa.
Figure 7: The logs have been taken again from the data in figures 5 and 6, in order to satisfy the assumptions for regression analysis; however, there just seems to be a cluster of points. It has decreased the variance as the points do not seem to be as random as figure 5.
Figure 8: Once the LOWESS has been calculated the relationship is much easier to see. The data is clearly linear.
DATE TIME TIDE GPSIZE GPLENG TOTAL %LOOK LLOOK
TIME 0.480
0.000
TIDE -0.107 0.746
0.029 0.000
GPSIZE -0.070 0.035 0.097
0.154 0.482 0.048
GPLENG -0.003 0.014 0.053 0.554
0.956 0.774 0.278 0.000
TOTAL 0.107 0.209 0.134 0.290 0.405
0.029 0.000 0.006 0.000 0.000
%LOOK 0.041 0.017 -0.002 -0.433 -0.347 -0.150
0.406 0.728 0.962 0.000 0.000 0.002
LLOOK 0.095 0.052 -0.017 -0.393 -0.287 -0.127 0.878
0.054 0.293 0.728 0.000 0.000 0.009 0.000
LGPSIZE -0.050 0.055 0.104 0.824 0.549 0.250 -0.505 -0.401
0.311 0.265 0.033 0.000 0.000 0.000 0.000 0.000
LTOTAL 0.061 0.128 0.074 0.364 0.388 0.854 -0.283 -0.249
0.213 0.009 0.134 0.000 0.000 0.000 0.000 0.000
LGPSIZE
LTOTAL 0.394
0.000
Key: Pearson correlation
P-Value
Table 1: Correlations for date, time, tide, group size, group length, total number of birds, percentage of birds looking, log of the vigilant birds, log of the group size and log of the total. The correlation between %LOOK and GPSIZE is -0.433
The correlation between LLOOK and LGPSIZE is -0.401
Therefore taking the logs slightly increased the correlation by 0.032.
Both have a very low p-value and are therefore highly significant.
Also by taking the log of the total and the log of the look it has increased the significance between the two TOTAL and LOOK (p < 0.002) and LTOTAL and LLOOK (p < 0.0005).
Figure 9: The dotplot of the residuals show that they are approximately normally distributed.
Figures 10 and 11: There is a linear relationship this is clear from the scatter plot and confirmed by the LOWESS graph. This shows that the residuals are independent from the fitted values and thus confirms all regression analysis assumptions.
Predictor Coef SE Coef T P
Constant 1.4637 0.1906 7.68 0.000
TIME 0.03721 0.01765 2.11 0.036
TIDE -0.02480 0.02132 -1.16 0.245
GPLENG -0.001249 0.001038 -1.20 0.230
LGPSIZE -0.20513 0.03520 -5.83 0.000
LTOTAL -0.06104 0.02803 -2.18 0.030
S = 0.2774 R-Sq = 18.4% R-Sq(adj) = 17.4%
Table 2: The regression analysis table shows the correlations between the predictor variables and the dependant variable and whether they are positive or negative (column headed ‘T’). And the P-values show whether each one is significant or not. They are all significant except the correlations involving the Tide and the Group length. This means they are not terribly good predictor variables.
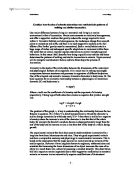
The regression equation is:
LLOOK = 1.46 + 0.0372 TIME - 0.0248 TIDE - 0.00125 GPLENG - 0.205 LGPSIZE
- 0.0610 LTOTAL
Source DF SS MS VR P
Regression 5 7.1104 1.4221 18.49 0.000
Residual Error 410 31.5405 0.0769
Total 415 38.6509
Table 3: This is the analysis of variance table (ANOVA). It shows that the variance ratio (VR) is highly significant (p < 0.0005), confirming that there are definite differences between the two groups, regression and residual error.
L
G L G
P T P
T T S O L
I I I T E
M D Z A N
Vars R-Sq R-Sq(adj) C-p S E E E L G
1 16.1 15.9 9.6 0.27988 X
1 8.3 8.0 49.0 0.29267 X
2 17.1 16.7 6.6 0.27857 X X
2 16.7 16.3 8.3 0.27915 X X
3 17.8 17.2 4.9 0.27766 X X X
3 17.4 16.8 6.8 0.27831 X X X
4 18.1 17.3 5.4 0.27748 X X X X
4 18.1 17.3 5.4 0.27751 X X X X _
5 18.4 17.4 6.0 0.27736 X X X X X
Table 4: This table examines the best predictors. The best predictor is log of the group size as this explains 15.9% of the variance in log of the look. The second best one is the group length. The best two predictors to use would be log of the group size and log of the total which explains 16.7% of the variance in log of the look.
Discussion
From figures 1 and 2 it is clear that there is a linear relationship between the group size and the percentage of the group being vigilant. This relationship is high and negative (table 1). Which initially supports the claim that the smaller the group is the more vigilant individual birds are. This is also confirmed by figures 3 and 4 which are the logged values of the group size and the percentage looking plotted and also figures 5, 6, 7 and 8 which are the total number of birds against group size and their logged values respectively. All of the above figures have highly significant correlations which are all negative (table 1). The plotted logged values all have increased correlations, i.e. are more highly correlated than their original values. This is to be expected as taking the logs of figures reduces the amount of variance making it more equal and a more linear relationship should be formed.
Figure 9 shows that the residuals are approximately normally distributed and figures 10 and 11 show that the residuals are independent from the fitted values, both of which help satisfy the regression analysis assumptions and so the analysis was calculated.
From table 2 the log of the group size and the log of the total are only really, the important values. Their correlations with the log of the look are both negative, as found in table 1 and confirmed here (column labelled T) and their corresponding p-values show that they are both significant. The group length and tide are negatively correlated to the logged look values but are not particularly significant.
The ANOVA table (table 3) confirms the independency of the two groups: regression and residual error and that it is highly significant (p < 0.0005).
Finally the best predictor variable table (table 4) show that all of the predictor variables explain only 17.4% of the variance in the log of the look, as opposed to just the best predictor variable, log of the group size, explaining 15.9% of the variance. There is only a difference of 1.5% which shows that it maybe possible to conclude that vigilant behaviour alters as a direct result of being in a larger or smaller group. It would be interesting to time taken by each individual feeding, for example, and the proportion of it’s day is taken up by feeding compared to being vigilant and to see if larger groups spend more time feeding thus this would then have an affect upon these results and may make them redundant.
Time of day should have an effect on the number of birds that are able to be seen. The data was mostly collected at low tide when there are larger areas of shallow water, rocks and sand for the birds to land on and have a chance to feed and preen. Where as if the data were collected during high tide there would have been fewer birds around, smaller group sizes and it would have made the data very difficult to collect. So it would be interesting to discover exactly the effect time of day has on the number of birds and whether they are more vulnerable to predators during any particular time of day or night.
A potential problem with this data would be that there are not many, if any, actual predators around that prey on Seagulls. If this was found to be a significant problem it would suggest that the vigilant behaviour of the Seagulls may have been directed more to others in the group or to the presence of others outside the group and could be in conjunction with John Krebs’ findings that they could have been more vigilant to find better feeding areas.
It does seem that group size affects the vigilance of Seagulls, however, there are too many other confounding variables that could make the results found in this experiment inaccurate. Other variables not discovered or taken into account in this experiment could have influenced vigilant behaviour and therefore it could not only be group size that affects the percentage of birds being vigilant.
Also it should not be assumed that the birds were being vigilant for just predators. Instead vigilance could include checking other members of the group and their activities (Caine and Marra, 1988, cited in Elgar, 1989), or individuals of other species are not predators. Further experimentation should be carried out in order to discover whether the time spent observing the activities of others is positively correlated with group size.
Elgar (1989) suggests further studies into the role of the predator and that it is possible that the time the prey detects the predator is always measured by the prey’s response. But not all animals give an alarm or similar warning instantly after detecting the predator. Or respond instantly to a given alarm. There is much more to be discovered in this area of animal behaviour and further investigation is needed to become certain on all influences.
References
Elgar M A (1989) Predator vigilance and animal group size in mammals and birds: a critical view of the empirical evidence. Biological Reviews, 64, 13-33.
Lazarus J (1989) Looking for trouble. New Scientist, 125, 1701, 62-65.
Fernandez G J, Capurro A F and Reboreda J C (2003) Effect of Group size on individual and collective vigilance in greater Rheas. Ethology, volume 109, issue 5, page 413.