Acid Test Ratio (ATR)
ATR is stringent indicator which determines whether Uffington Plc has enough short-term assets to cover its immediate liabilities without selling inventory. It’s a more strenuous test than Current Ratio primarily because the ATR allows for inclusion of inventory assets. In 2009 the ATR for Uffington was 0.42:1 however the previous year (2008) it was slightly better at 0.43:1. With the industry average at 1.87:1 one would be forgiven in thinking that Uffington need to be worried that their very low score indicates that they are performing badly against its main competitors. However the two figures are not very different therefore you could deduce that Uffington is enjoying consistency in meeting its liabilities.
Average Settlement Period for Trade Receivables (ASPTR)
Uffington Plc has to demonstrate how readily it will pay companies who have supplied goods and services on credit. Looking at the industry average ratio for this 28 days or 1 month seems to be pretty reasonable, however Uffington finds itself in a very favourable position because for the past two years its ration has been 13.3 days in 2009 and 12.2 days in 2008. As McLaney & Atrill, 2007, page 235 point out this very quick return has the effect of ensuring the goodwill with its suppliers is maintain ensuring that the supply chain is constant and not brought to a halt at any time over payment disputes. Though trying to expand those timescales may be beneficial to the cash flow of Uffington in the future as it would give them financially more room for manoeuvre.
Average Inventories Turnover Period (AITP)
Uffington’s AITP for 2009 was 42 days and for 2008 43 days, this is marginally greater than the industry average of 36 days. The business need to have its stock control finely balanced, too high an inventory means the higher the carrying costs and greater risk of its good becoming obsolete too low and it could result in the loss of sound business opportunity. Inventories represent a significant investment for Uffington if they hold onto it for any great period of time then its business activities could stagnate.
Gearing Ratio (GR)
Gearing Ratio is a tool which compares the owner's equity (or capital) to borrowed funds. Gearing is a measure of financial leverage, which demonstrates the level a firm's activities are funded by owner's funds verses creditor's funds.
One could argue that in the current climate the Gearing Ratio for the industry average seems rather high risk at 70% anyone looking to invest in a company as opposed to the lower risk implied by Ufflington Plc for 2009 14.13% and 15.44% for 2008.
Price/Earnings Ratio (PER)
Using this measurement tool, you would have to bear in mind the longer term aspirations of Ufflington plc whose PER for years 2009 and 2008 is 10.9 times and 10 times respectively. Comparing this to the industry average of 10 times you can see that the PER is consistent and representatively deemed as low risk for the speculative investor. A steadily increasing PER can be seen by investors increasingly speculative (high risk) it takes longer for earnings to cover the stock price. Therefore when the stock price changes so will the ratio. For a more meaningful analysis earnings and PER should be looked at over several years and with PER’s in the same market sector and with the market as a whole.
Conclusion
Ufflington Plc at first glance looks like it is a company that is failing but by analysing each of the seven performances above we can see that in fact against a volatile market the business seems to be holding its own.
Question 3
Based on the data available to Kathryn regarding the potential purchase of shares in Uffington Plc I would give her the following advice before final decision.
If Kathryn invested in an instant access savings account at the market average of 2.64%[1] currently lower than inflation her return would not be as great in the longer term than the Uffington Plc PER which returns £1 per £10 invested or 10%. Having said this would inject a word or two of caution.
The financial ratios demonstrated above are rather limited in their usefulness. A reference point must be utilised based on historical values, forecasts and comparative ratios of Uffington Plc and its competitors. These ratios when looked at individually may not have much meaning but place them together then a picture can be painted of the company’s current financial position. Ensuring average values are used will limit fluctuations to ratios due to seasonal factors. Also comparing Uffington’s accounting methods with similar organisations would give a balanced view.
Note that 7 ratios given fall into the classifications of financial ratios;-
Profitability - GPM
Efficiency - CR, ATR
Liquidity - ASPTR, AITP
Financial Gearing - GR
Investment Ratio - PER
Grouping the ratios in this way is beneficial to analyse Uffington’s business transactions however in this case I feel that further analysis is required in the areas of profitability and investment. Therefore Kathryn could apply ROSF – Return On Ordinary Share Funds This ratio compares profit for the period available with the average stake in the business. This information Kathryn could ascertain from previous years company accounts.
Another profitability check ROCE – Return On Capital Employed could be utilised as a measure of performance and the relationship between operating profits during a period and average longer term capital investment.
Within the investment ratios it could be argued that Earnings Per Share (EPS) could be analysed on an individual basis from its utilisation in the PER. Uffington Plc’s EPS gives a clear indication to the earning potential of the business which is available to its shareholders to the number of shares issued. This measurement of share performance gauges investment potential, however caution would need to be exercised because if shareholders in crease capital share in the business it doesn’t always mean the EPS would increase accordingly.
Therefore in conclusion and after looking at the additional ratios which seem favourable I would suggest to Kathryn that in the current climate investment in Uffington Plc shares would be a good idea as opposed to just keeping her saving in an instant access or indeed medium term savings account. However with this type of investment I would council that the markets fluctuate periodically and that she may not get the return she is hoping for in the short term. To get a good return she may have to leave her investment with Uffington for a longer term than she may feel appropriate. Though I would also suggest that she gets a more independent view from a recognised independent brokerage who would be better placed to offer impartial advice. (1676 words)
Part 2
Question 1
Clearly the experiences of Nortel during the internet boom and crash, the financial implications from decisions made during that time are still being felt. Nortel recognises to achieve long term goals it needs to apply stringent measures to keep at forefront of the marketplace.
From my learning in block 4 the most important phase Nortel needs to embark on, is within its Capital Investment decisions. It is clear from the brief that they need to drive down operating costs and release its constrained cash flow. Which should attract the investor.
Evaluating the investment proposals ensures that what is being considered covers all the costs and benefits and is the right way forward, optimising the earning power of its components and products within a time scale acceptable to the shareholders.
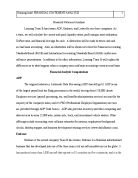
Accounting Rate of Return identifies the average operating profit / average investment to earn that profit expressed as a percentage. This allows for component depreciation over a given period of time. Therefore implementing robust systems of recycling and repairs ensures maximisation of product life. Though I would advocate caution with this measure as it doesn’t take into account time.
Using the payback period is a better measure, taking into account the time it takes for initial investment to be repaid. Therefore Nortel’s investment into reverse logistics takes into account the current ARR and PP then makes adjustments to the capital investment it needs to get the project off the ground and future investment.
However all these decisions have elements of risk exposure associated and considerations will have to be borne in mind, as investment rates of return increase so proportionally does the risk, the accounting management team needs flexibility to react decisively when required.
Although I have only focused on one area of accounting and finance in block 4 it is recognised that the financial ratios mentioned in part 1 of the TMA and preparation of various balance sheets, income statements and cash flow reports will provide a picture of the financial health of Nortel before final decisions made on further investment or more constraints imposed. (345words)
Question 2
I have only had limited exposure to the TGF this time due to my endeavours to catch up with the main bulk of reading. What I have posted I hope has added to the discussion but alas I know with my late postings impact can be lost.
References
[1] (accessed 21/02/2011)