Return on Capital Employed (ROCE)
It is regarded as the key measure of business profitability. It measures the return that a business generates from the resources available to it( capital employed) during the period.
It is expressed as an annual percentage return and is calculated as follows.
ROCE = Profit before tax * 100%
(Total assets - current liabilities
financial statements show an ROCE of 15.91%for 2007,this is 7% decrease from 17.11 2006 figure. Although there are no firm benchmarks, the results of ROCE expressed as a percentage should ideally be higher than the rate of interest incurred by debt financing (Source: ).
As the current ROCE is 15.91%, fixed interest that the company should pay is 4.98% on bank loan therefore part of the capital employed available for the owners is the difference of 15.91-4.98%.
Financial ratios:
Gearing ratio
Gearing ratio measurers the extent to which a company is financed by debt rather than by shareholders’ equity. A company with a high part of debt to equity regarded to be highly geared.
Gearing ratio= Short term loan + overdraft + long - term liability*100
Shareholders funds
Interest Cover ratio
It is used in conjunction with the gearing to determine the company’s debt raising capacity. It indicates how many times the interest payable is covered by the operating profit of the company as in the long-run, interest payments can only be paid from profits.
Cranswick plc gearing ratio at the end of 2007 was 63.73%%. It has slightly declined by 19% compared with FY06 79%. The level of the gearing would not be considered as being high. The decrease observed for Cranswick Plc gearing over the past year is mainly due to the decreased of the financial liabilities £77441m in 2006 to £76216m of 2007(p58)also so by the increase of the equity. Although the gearing level slightly high, the company is able to generating enough profit to cover interest charges on their loans as their interest cover is 7.94imes respectively in FY07.
Cranswick plc has unsecured loans which is repayable in 5 semi– annual instalments of £5625000 from 01/09/2007 at a margin 0f 0.5 to 0.8 % above LIBOR. They receive LIBOR interest and pay fixed interest of 4.98%.
Liquidity Ratios:
Liquidity ratios are fundamental to the businesses as a going concern. Their purpose is to assess the capability of the company in meeting its short term (maturing) financial obligations.
Current Ratio:
It shows the extent to which current liabilities are covered by both cash an non cash asset that can be converted into cash within reasonable short time. The ideal ratio is to 2:1 (i.e. £2 of current assets for every £1 of cur rent liabilities). However, the type of business should be considered before deciding whether a company is insolvent or not. A much lower ratio indicates a company that could face liquidity problems in the future. It is calculated as follows:
Current ratio= Current assets = 2:1 times
Current liabilities
As seen in the table above, it has £1.09 of current assets to meet £1.00 of its current liabilities in 2007, a light increase of 0.06% compared with 2005, when it was £1.03. This is due to the increase of the. The company is likely to be able to meet their current liabilities in near future.
Quick Ratio:
It measures the immediate solvency of the company by showing the extent to which its current liabilities are covered by cash and receivables only. Stocks are excluded because they are less liquid than receivables.
The norm is of 1:1.
Quick Ratio= Current Assets - Stock = No. Times
Current Liabilities
As you can see that Cranswick Plc has acid test ratio which is below the minimum level of 1:1in both years, and do not cover the current liability. As this suggests potential liquidation problems, but the company seemed to be the type of business which tents to have a low quick ratio and survives.
Efficiency Ratio
The efficiency ratios are part of the control ratio. A control ratio measures the performance of a business and is used to identify the need to review and if need be, change the standard hours budgeted for the output of units. The three ratios that form the control ratio are efficiency, capacity and the activity ratios. Each ratio’s element includes labour hours (input) used to produce the number of units (output) for both standard and actual results.
An efficient organisation maximises output by minimising input using the least resources available for use. Efficiency is reflected on a manager’s perception of the business and different managers will have different objectives.
Debtor days ratio
This ratio tells us the average length of time it takes for invoices to be paid, otherwise known as the collection period. The debtor turnover day’s ratio is calculated by dividing the number of trade debtors over the volume of sales x 365 days as follows:
Reasons for long payment days from debtors can vary from, late paying customers or credit control procedures either not in place or strictly adhered to. If the days are longer than the most commonly used thirty days, this will have a bad affect on the management of the cash flow and will affect the working capital.
Cranswick have slightly increased for the length of time debtors pay from years 2006 41 to 39 days in2007. The average credit taken by their employees is 35 days (annual report p 29)
Creditor Turnover Days
The creditor turnover days are similar to debtor turnover days except the creditors are the suppliers of the business. This ratio shows the average length of time it takes for the company to pay its suppliers.
In 2007 Cranswick took 36 days to pay its suppliers, and this is in line with the average of the credit terms of the group as it is 38 days,
Pat 2
A) Discussions a bout merits of the financial statements and whether the company give a fair return to its investors.
IAS1 sets out the stricture and content of financial statements which companies must be followed in presentation and preparation of their financial statements. The purpose of the standard is to give a fair presentation of company’s performance and financial position for the users such as investors.
The objective of the financial statements is to provide an overall view of the financial position and performance the company.
(Maclaney.E., Peter. A ,3rd Addition. Published 2005. Accenting an introduction. P28)
The standard requires that financial statements be visibly identified and distinguished from other information produced in same period of time.
The financial statements consist according to IAS1:
Income statement:
Is a statement which provides information and measures the financial performance of company during the accounting period, by showing a summery of how the company‘s income is generated and expenditure incurred for the both operating and non operating activities. One of its merits that it assesses the shareholders and potential investors whether the company is profitable or making loses and how the company performed financially, it also gives.
However ,The limitation side of this statement is to do with accounting adjustments which can twist net income, also the net income can not give to users nay indication about future income prospects of the company, its brand, or whether the profit was purely resulted any change in accounting method. (, 2007)
Balance sheet statement: the purpose of this statement is to show the net worth and the position or strength of the companies at a specific moment of time. Where it shows the list of assets and the liabilities of the companies and whether the business is funded by shareholders fund or by debt.
On the other hand the statement has some limitation including:
The information in the statement will become old when company publishes its balance sheet, and the structure can be change significantly.
Although companies follow the accounting policies, some companies easily manipulate their balance sheet statement to make it look health as possible.
As balance sheet depends on presentation, assumptions and accounting methods used may not asses in making capital decision.
(http://www.asset-analysis.com/equities/fund_bslimit.html)
Cash flow statement:
It analysis the movement of the business’ cash, where it reports cash generation and absorption for a period by highlighting the significant components of cash in away that assists users of the financial statements in comparing the cash flow performance of other companies in the same sector.
It also provides useful information that assists in the evaluation of companies’ liquidity, solvency and financial adaptability. (AAT, unit 11 published by bpp professional education 2007)
Cash flow statement does not provide complete information in assessing future cash flow as it based on historical information. It can also be manipulated for example by delaying payments to suppliers and pay them after the year end or by selling part of their assets on purpose to repurchase them. (KAPLAN, 2.5 financial reporting 06-07)
As per the audit opinion the financial statement of cranswick plc has been prepared in accordance with IFRS and it gives a true and fair view of the state of their affairs and profit as at 31st March 2007. (p78 annual report)
As per the annual report profit attributable to members was £6665000 compare with £10160000 in 2006. The equity dividends declared and paid during the year was a final dividend for 2006 of 4959000, interim dividend for 2007 of £2667000 and declared final dividend of £5607000 for 2007. (P47anual report)
Therefore Cranswick plc is has healthy financial position with positive cash flow which gives a fair return to its investors.
b)How company provides segmental information and changes upon adoption IFRS8
Under IAS14 listed companies are required to disclose segmental information in accordance to each business segment and geographical region. The standard also requires that a segment of a company’s operations should be reported separately if its revenue profit or assets are 10% or more of the total. companies primary segment reporting may be based on either business or geographical segment, in primary reporting companies are required to disclose for each segment : revenue operating result operating asset an liabilities, capital expenditure and depreciation of different products and services that accompany provides. (Alexander. D., Nobes. A., 3rd Addition. Published 2007. Financial Accenting)
Cranswick group’s segment information has been reported in accordance with IAS 14. Their primary reporting segments contains business segments and its secondary format is reported on geographical segments.
The group business segments are food and Pet business and are based on internal management and reporting structure, the both segments exhibit different risks and rates of return. They are no significant transactions between business segments
Geographical segment on sales revenue, an analysis of sales by derivation is reported by allotting revenue to the location in which the sale took place, it also geographically analysis the group’s assets and additions to property, plant equipment.
This segment reporting is meant to help the users (e.g. investors) in assessing the past performances and future prospects of the segments interns of their profitability, growth and risk prospect.
In 2006, the IASB issued IFRS8 which requires reporting on the basis of the segments reported to the company’s chief operating officer. Under IFRS 8 segment reporting is done in accordance to the management approach.
(Alexander. D., Nobes. A., 3rd Addition. Published 2007. Financial Accenting)
The adoption of the IFRS 8 by the company may or not have an impact on how they identified their reportable segments, as it depends on how the company applied IAS14 in the past. The group’s segments may require to be identified on the basis of internal reports that are regularly reviewed by the company’s chief operating officer to evaluate and allocate resources of each segment. (http://www.iasplus.com/standard/ifrs08.htm)
As per the Cranswick groups’ annual report there will be no impact on their reported Income or net assets when they are to adopt IFRS 8. P42
However the group will have to disclose additional information about its operating segments. As such:
- The company will have to expand their geographical segment requirements, so the disclosure of revenue/assets is shown by individual foreign country; this applies to Cranswick since they have a global business. However, if the information that is required for analysing is not there and available, the cost to develop it would be too much and details must be disclosed.
- Explanation on how the group measured their reportable segments in terms of profit or loss, assets and liabilities of each reportable segment.
- They will have to reconcile and disclose the total reportable segment revenues, asset, liabilities and other material items to corresponding with company’s financial statements.
- Information about their key customers,
(http://www.iasplus.com/standard/ifrs08.htm)
The extra disclosure will put some financial burden on the company and the consequences for the company will be in terms of extra costs.
c)
IAS1 Revised
The International Accounting Standards Board has revised version of Accounting standard (IAS 1); presentation of financial information. As per the press release, IASB aimed to formulate general purpose for the presentation of accounting reporting standards so as to harmonise presentation of financial statements, in so doing these financial information can be readily analysed by various stakeholders and this will enhance the comparability of the financial information across industries, as well as within same sector industry.
Key changes as per the press release.
As per the press release of 6th September 2007 the mentioned changes are to be effected by 1st January 2009; although earlier adoptions of the changes are welcomed by companies.
As per Deloitte (2007) IAS Plus, the changes are to enable readers of the financial information to analyse changes in company’s equity from resulting from transactions with owners in their capacity as owners such as dividends and shares purchases) separately from non-owners changes (such as transactions with third parties.
Equally, the revised changes are prescribing the changes in the title of the financial statements to reflect their function more clearly; for example the balance sheet is renamed ‘a statement of financial position; income statement will become ‘statement of comprehensive income’; and cash flow statement will become ‘statement of cash flow’.
There is going to be the disclosure of income tax relating to each component of other comprehensive income and also the disclosure of reclassification adjustments relating to components of other comprehensive income. Comprehensive income for the period includes profit or loss fro the period plus other comprehensive income recognised in that period. These components of other comprehensive income include the following: changes in revaluation surplus (IAS16 and IAS 38); gains and losses on defined benefit plan recognised in accordance with paragraph 93A of IAS 19; gains and losses arising from translating the financial statement of a foreign operation (IAS 21); gains and losses re-measuring available for sale financial assets (IAS 39) form part of the comprehensive income.
My allotted company, Cranswick plc like other companies rely on financial institutions for funds and as such the revised changes will bring about the harmonisation of financial statements so as these various stakeholders may make comparability of financial information in their dealings with the company. This also helps various stakeholders make informed judgements with their day to day transactions as the financial information is readily compared with other companies and this also brings about transparency in the market place.
( 2007)
(http://www.iasplus.com/dttletr/0607ias1ed.pdf)
However, the revised changes may put financial burden on companies, as the implementation of the revised changes may result in training of staff.
As per the press release, IAS 1 resulted in the amendments of five IFRSs, twenty three IASs and ten interpretations. This means the existing framework does not support the revised structure which may result in misinterpretation of the revised IAS 1 in the short run as people usually take time to adjust to such change.
Re-computation Cash flow from operating activities
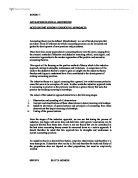
My Assumptions:
1 The employee cost assumed is included in the operating cost
2I assumed that subsidiaries trade & other receivables is not included in the opening balance of the Group’s receivables balance as in their calculation of decrease and increase of debtors in their indirect cash flow computation added this amount see cash flow statement. Also assumed that subsidies receivables as trade receivables.
3 I have not recalculated the depreciation because the amount charged for the year was clear in their notes and assumed as it is part of cost of sales.
4 Finance lease assumed not part of prorating activities.
5The difference between my tax calculation and the tax paid as per indirect computation cash flow assumed as no disclosed tax charged there for i used tax paid in their in cash flow statement .
Appendix C
Gearing
Profitability
Liquidity
Efficiency
Bibliography and References
Books
.
(Maclaney.E. , Peter. A ,3rd Addition. Published 2005. Accenting an introduction)
(Alexander. D., Nobes. A., 3rd Addition. Published 2007. Financial Accenting
1. Alexander, D. et al. (2007). International Reporting and Analysis 3rd Ed. London: Thomson.
(AAT, unit 11 published by bpp professional education 2007)
Web references
www.cranswick.co.uk
( 2007)
(http://www.iasplus.com/dttletr/0607ias1ed.pdf)
)
(, 2007)
(http://www.asset-analysis.com/equities/fund_bslimit.html)