- Boeing will not be able to Cross-subsidize henceforth: the wide-bodied aircrafts had much larger margins than did the small and medium sized aircraft. Boeing enjoyed an absolute monopoly in the VLA segment. As a result, it could use some of its margins to cross subsidize its smaller and medium sized aircraft making them more price competitive than Airbus models. Airbus’ entry into the VLA segment would cause this monopoly to end. As a result, Boeing would not be able to continue to cross-subsidize its lower range of aircraft. This would make Airbus more competitive in the other segments, thus increasing the total value proposition of the company.
- Today, sales have been low for Boeing, while Airbus has been standing strong with their shorter range aircraft sales, which booming discount carriers are nuts over, such as the A319 and the A320. Sales have almost stopped for the Boeing 747. The reason for this, is rather quite simple. Airlines are possibly avoiding the 747 because of the larger Airbus A380 which will soon be available. Some important carriers, like British Airways and United Airlines, have converted some 747-400 orders to smaller 777’s. Asian carriers aren’t even looking at the 747 as an option, they’re all ordering 300-seat aircraft like the Airbus A340 and the Boeing 777
Financial Valuation of Airbus A3XX
Key Assumptions
1) Operating profit: As of 2008, the price per plane is $225m, the number of planes in steady state production is 50, and the constant operating margin is 15%. We have ignored leaning curve effects. Incorporating learning effects and starting with a much lower initial margin lowers NPV unless one assumes that the operating margin exceeds 15% at some point in time.
2) Cost Structure of the A380 project
The cost to launch the A380 was $13 Bn, which comprised of:
- R&D expenses - $11 Bn
- Prop., plant & Equipment - $1 Bn (Straight line depreciation over 10 years)
- Working Capital - $1 Bn
3) Financing structure
The financing structure for the A380 project was as follows:
- Vendors (Risk Sharing partners) - $3.5 Bn
- Launch aid (National Govts) - $3.6 Bn
- Promoters capital (Airbus partners) - $5.9 Bn
The Risk sharing partners and Launch aid were both arranged such that the payments were made by Airbus on a per-plane basis. Hence, the repayment of these debts is contingent to the sales of the A380. Therefore, in case the demand forecasts are not met, and the A380 project does not break even, then these partners will not get their full repayments. In this respect their status is similar to that of Equity (preferred stock to be more precise). Hence we can consider that the A380 project is 100% equity financed venture initially. Hence the discount rate for the Cash flows can be taken as the Asset cost of capital instead of using the levered equity cost of capital.
4) Discount rate calculations
The following values are assumed for the various parameters:
- Risk free rate = 6% (assumed to be the rate on the long term govt bonds)
- Beta = 0.84 (average riskiness of the industry)
- Market premium = 6-8%
Using the CAPM model, we estimate the discount rate as anything between 11% to 12.7%. We take 11% as the discount rate for calculation purposes.
The tax rate assumed for calculation purposes is 38% as per the standard French tax rate including Social contribution.
5) Inflation treatment
The list price of the planes is assumed to increase by a constant rate of 2% in line with the expected inflation rate over the forecast period. After 2021, the value is taken as a terminal value. This is perpetuity with a growth rate of 2%. Using an operating margin of 15%, this terminal value comes out to be approximately $15Bn.
6) Operating Margin
The operating margin is assumed to be 15% in the year 2008 (a sensitivity analysis has been done on the value of this operating margin). To achieve this margin, the list price of the plane must be around $225 mn. Using this as the base figure the remaining values of the list prices over the period from 2006 (when the first deliveries are scheduled) to 2021 is calculated keeping in mind the constant inflation effect.
A slight catch in this calculation is that the case mentions that Airbus gave discounts of around 35-40% on the list price to the initial buyers. In its first year, there were 62 A380 orders. If we consider the average price of these planes to be $216Mn, then in effect, Airbus is giving discounts worth approximately $80Mn. The cash flows in 2006 will be reduced to this extent.
7) Treatment of Capital Expenditures
The capital expenditures in the post 2006 period are assumed to be equal to the depreciation, considering that the industry would be beginning to mature by then, and the Capex would be required to cover for the diminution of asset value due to depreciation.
8) Demand determination
The capacity of A380 plane production at Airbus is expected to be 4 planes per month by 2008. Hence the yearly capacity is around 50 planes. For the sake of the analysis we assume that Airbus is in a position to reach full capacity utilization by 2008. The capacity utilization is assumed to increase progressively from 25% in 2006 to 100% from 2008 onwards.
Hence the sales of the planes is around 50 planes per year post 2008 (Sales is equivalent to the capacity, since planes are likely to be built only to order). This multiplied by the list price of $225Mn in 2008 gives us the cash flow from plane sales for the A380 project.
9) Breakeven statistics
The case mentions that Airbus needs to sell around 250 planes on an undiscounted cash flow basis. But when the discounted cash flows are concerned, then Airbus must sell at least 450 planes by 2021, to have broken even. At present, the assumed sales are such that around 700 planes are sold by 2021.
Financial Analysis
How optimistic do we have to be about the volumes of and margins on super jumbos to make the project a value-enhancing proposition for Airbus?
In the base case, we assume Airbus will sell 50 planes per year in steady state after an initial ramp-up period for a total of 701 planes by 2020. This number is slightly less than its stated goal of capturing half the projected market for super jumbos (1/2 * 1,550 planes = 775 planes).
More interestingly, Airbus assumption exceeds the average number of 747’s Boeing has sold over the past 30 years (35.2 planes per year).
We also assume the realized price in 2008 will be $225 million, which will produce an operating margin of 15%. This is a substantially higher margin level than reported by Airbus overall, or for that matter Boeing, although it does fall in between estimates in analysts’ reports that assume average margins of 14% and 19%, respectively on the super jumbo over the next 20 years. Some analyses do predict margins as high as 20-30% over time, on the grounds that margins tend to be higher on larger planes, but such predictions seem to assume away competitive pressures. They also seem high in relation to estimates that Boeing, with more than 1,000 planes of cumulative production, has operating margins of 15% to 20% on its 747 jumbo, which monopolized its niche prior to the super jumbo.
Using a discount rate of 11.0%, these inputs imply an NPV of $130.7 million. Of this amount, investment outflows have an NPV of negative $5.69 billion, operating cash inflows through 2020 have an NPV of $4.23 billion, and the terminal value has an NPV of $1.81 billion assuming 2% growth. It is interesting to note that without the terminal value for sales after 2020, the investment has a negative NPV of $1.46 billion.
Appendix 2 shows sensitivity analyses along several dimensions: operating margins, discount rate, tax rate, inflation rate, unit sales, investment expenditure and realized price.
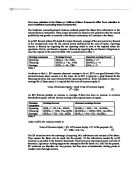
Reducing the operating margin from 15% to 10% reduces the base case NPV by approximately $2.0 billion and to 5% by another $2.0 billion.
Reducing the steady state number of planes sold from 50 to 30 reduces the NPV by $2.1 billion.
Increasing the R&D investment cost from $9.7 billion to $11.7 billion reduces the NPV by $1.0 billion. Finally, delaying the initial sales by two years reduces the NPV by $1.0 billion.
Conclusion
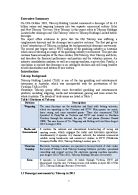
As from a strategic point of view, it makes immense sense for Airbus to venture into the VLA market and go ahead with its plans of manufacturing A 380.
But the picture looks completely different from the financial point of view. The NPV for the projects are slightly positive to negative. The NPV values calculated are very sensitive to various assumptions made and fluctuate a lot with minor changes. Also the assumptions regarding the operating margins and steady state of no. of planes sold per year seem to be on higher side.
Keeping both the strategic and financial views in mind, we conclude that Airbus decision of going along with A 380 is a high risk high returns strategy. Airbus has to be devoted fully to the development of A 380 to meet the deadlines and hope for the global economy and aviation industry to grow in coming future.