OSK-UOB Unit Trust Management Berhad 500,000
Allianz General Insurance Malaysia Berhad 50,000
Allianz Life Insurance Malaysia 200,000
Kam Kar Cheong 1,550,000
11,250,000
- Malaysian Public
3,000,000 public issue share will be made available for application by Malaysian citizens, companies, societies, co-operatives and institution of which at least 30% is to be set aside strictly for Bumiputera individuals, companies, societies, co-operatives and institutions.
The adviser and the underwriter of Silver Bird was RHB Sakura. The listing date for the company lied on 5 June 2002.
Pricing of IPO shares
The issue/offer price of RM0.90 per share was determined and agreed upon by the company, the offerors and RHB Sakura as adviser and managing underwriter. The final issue price was determined after consider the following factors:
- The group’s financial and operating history and conditions.
- The future plans and prospects of the group.
- The market price of companies engaged in similar business.
- The forecasted price earning multiple of 7.87 times based on consolidated forecast net EPS of 11.43 sen for the financial year ending 31 October 2002 computed based on the enlarged share capital of 80,000,000 shares and the issue price of RM0.90 per share.
- The proforma consolidated NTA per share (RM0.69) as at 31 October 2001.
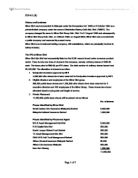
The gross amount received by the company from the Right issue and Public issue was RM28, 212,000. The amount received will be utilized as follows:
RM
Cost of construction and acquisition for plant and machinery
For new factory and corporate office 15,800,000
Repayment of bank borrowing 9,000,000
Working capital 1,512,000
Estimated listing expenses 1,900,000
28,212, 000
RHB Sakura, the underwriter of the company have agreed to underwrite all the public issue shares at an underwriting commission of 2.5% of the issue price of RM0.90 per share and the 3,000,000 public issue shares to be placed to Great Eastern Life Assurance (Malaysia) Berhad and Malaysia Insurance Berhad at an underwriting commission of 0.25% of the issue price of RM0.90 per share.
The company start trading on the KLSE by 5 June 2002 initial price of RM0.90 and the first day closing price was RM1.08 (Rashid Hussein Securities, 2002). The percentage change from IPO price was 20%. Obviously, the stocks have been under priced. This is a good sign during that period, the economic was still in uncertainties and the KLCI performance was not encouraging.
Most of the newly listed company had an overpriced IPO during their first day of listing. There are few theories that provide explanation for the IPO under pricing.
First of all, the Signaling Theory suggested that high quality firms under price their issues to signal their quality to the market. With some patience, the issuer can recoup his up front sacrifice post-IPO through future issuing activity or analyst coverage. (Welch and Ritter, 2002)
Besides, according to Information Asymmetry Story, under pricing may enable a firm to learn about its true value. (Benveniste and Spindt, 1989)
Litigation Insurance Story by Ibbston (1975) and Tinic (1988) suggested the issuers intentionally under price IPO to insure themselves against future liability.
Listing proceeds
Shareholders receive: =RM28, 212,000
Listing expenses = RM1, 900,000
Net proceed after listing expenses = RM28, 212,000– RM1, 900,000
= RM26, 312,000
Shareholders’ gain =20,100,000 *(RM1.09—RM0.90)
= RM3, 819,000
The underwriter had gone through a list of evaluation process before arriving to the final issuing price (RM0.90). The evaluation process had taken into consideration of the company forecasted EPS, NTA, P/E ratio, the industry, various risk factors, etc. It is not an easy task in the initial stock price determining process since there were no shares being traded before. Furthermore, the figure was derived based on forecasted information. As we know, forecasted information would not be accurate. Since the figure was derived by evaluating EPS, NTA, and P/E ratio, we will examine the applicable of each financial ratio.
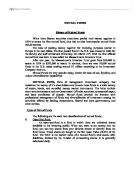
Figure below shows the share price movement of Silver Bird since its first trading day until 17 January 2003.
Source:
P/E ratio
P/E is short for the ratio of a company's share price to its per-share earnings. As the name implies, to calculate the P/E by simply take the current stock price of a company and divide by its earnings per share (EPS). Theoretically, a stock's P/E tells us how much investors are willing to pay per dollar of earnings. Many people use it to determine whether the stock is "expensive" or "cheap".
P/E ratio = Market value per share
EPS
Since Silver Bird had never listed before in the KLSE, there will be no market value per share available; one of the options to calculate P/E ratio is by applying others companies in the same industry’s (competitors) data.
Silver Bird P/E ratio = RM0.90/11.43 sen
=7.87 times
The table below shows the estimated P/E ratio for the past 5 years.
Observe from the estimated P/E ratio for the past 5 years, Silver Bird had set a relatively high P/E ratio in year 2002. A high P/E ratio indicates that the company is having ample growth opportunities and has higher earnings in the future.
The majority of the time the P/E is calculated using EPS from the last four quarter.
The EPS figure comes from estimated earnings expected over the next four quarters. This is known as the leading or projected P/E.
However, there are some problems with P/E. first of all, Earnings is an accounting figure that includes non-cash items. The guidelines for determining earnings are governed by accounting rules () that change over time and are different in each country. To complicate matters, EPS can be twisted, prodded, and squeezed into various numbers depending on how you do the books .The result is that we don’t know whether we are comparing the same figures, or apples to oranges.
Secondly, when there is a high inflation, inventory and depreciation costs tend to be understated because the replacement costs of goods and equipment rises with the general level of prices. Thus, P/E ratios tend to be lower during times of high inflation because the market sees earnings as artificially distorted upwards. As with all ratios, it's more valuable to look at the P/E over time in order to determine the trend. Inflation makes this difficult, as past information is less useful today.
Net Tangible Asset (NTA)
Tangible assets refer to assets in a balance sheet, which can be physically identified such as buildings, land, inventory, plant and equipment and cash are termed tangible assets. In determining the net worth of a business it is thought by many to be prudent to ignore the intangible assets. It is one way for a company to determine its IPO price by evaluating the net worth of the company asset.
The book value of a stock = Shareholders’ funds
Total number of outstanding ordinary shares
NTA per ordinary share is 0.69.
The main disadvantage of using NTA method to determine IPO price is that the figure is based on historical accounting data and may not truly reflect the current values of the company’s assets. Besides, this method does not take into consideration the quality of the company’s asset and lastly NTA method also does not reflect any contingent liabilities or off balance sheet items that may have been incurred.