4.0 Introduction 4.
5.0 Findings
Product sales figures from 1998-2000 5.
Product A trend and A.S.V 6.
Product B trend and A.S.V 7.
Product C trend and A.S.V 8.
Product comparison graphs 9.
6.0 Predicted sales forecast for 2001 10.
7.0 Conclusion 11.
8.0 Recommendations 12.
9.0 Glossary of Terms 13.
(3)
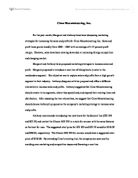
INTRODUCTION
This report highlights the growth of products sales A and C and highlights the decline in sales for product B.
We can see from this report that that future analysis will need to be conducted in the market demand and competition for product B
(4)
Product Sales Figures for 1998-2000
(5)
PRODUCT A TRENDS AND A.S.V
(6)
PRODUCT B TRENDS AND A.S.V
(7)
PRODUCT C TRENDS AND A.S.V
(8)
PRODUCT COMPARISON GRAPHS
Product A
Product B
Product C
(9)
2001 FORECASTED SALES FIGURES
On the assumption that trends continue on all products throughout 2001 the following figures were derived.
Product A:
Product B:
Product C:
(10)
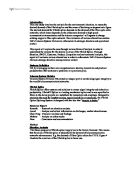
CONCLUSION
Figures show that we have an increasing trend for both products A and C with increasing sales figures over the period 1998 until 2000, Also highlighting concerns over Product B which has decreased over the same period.
Product A: Increasing from 280 sales in Q1Y98 to a recorded figure of 315 in Q4Y00 given a total increase of 12.5 % in sales over the 3 year period.
Best quarters for this product being Q2 and Q4
Product B: Decreasing from 500 sales in Q1Y98 to a recorded figure of 365 in Q4Y00 given a total decrease of 27 % over the 3 year period.
Best quarters for this product being Q1 and Q3
Product C: Increasing from 200 sales in Q1Y98 to a recorded figure of 265 in Q4Y00 given an increase of 32.5% over the 3 year period.
Best quarters for this product being Q3 and Q4
(11)
RECOMMENDATIONS
Product B is a main concern for the company with a reduction in sales figures of 27 % whilst both A and C continue to increase in this current climate.
Product B will need to be investigated further to explain in more detail why these figures are reducing over this period. We need to evaluate the market demand and competition for this product alongside the seasonal variations to determine the best course of action for this product if we want to continue to lead in the future.
(12)
GLOSSARY
QTR Abb; Quarterly figures by dividing the financial year into 4
MT Moving Totals are calculated from 4 Quarter sales figures for an individual product.
CMT Centred Moving totals; created by adding 2 moving totals to recentre the moving totals to obtain the trend
TREND This is calculated by dividing the CMT column by 8 and giving us a centred moving average i.e. Trend
SV Seasonal variations must be calculated using production minus the trend.
ASV Average seasonal variations; Each individual quarter is totalled and divided by the amount of years the analysis is being conducted
FORECAST On the assumption that the trends will continue in the direction determined by the analysis. This is calculated by change in value of trend over how many quarters the report was run.
(13)