Private Forex Remittance vs Car Sales …………………………….. iii
Private Forex Remittance vs Car Sales(ROG) …………………….. iii
Maruti Udyog Limited : An Overview
History of the Company
Maruti Udyog Limited (MUL) was established in Feb 1981 through an Act of Parliament, to meet the growing demand of a personal mode of transport caused by the lack of an efficient public transport system.
Suzuki Motor Company was chosen from seven prospective partners worldwide. This was due not only to their undisputed leadership in small cars but also to their commitment to actively bring to MUL contemporary technology and Japanese management practices (which had catapulted Japan over USA to the status of the top auto manufacturing country in the world.
A licence and a Joint Venture agreement was signed between Govt of India and Suzuki Motor Company (now Suzuki Motor Corporation of Japan) in Oct 1982.
The objectives of MUL then were
- Modernization of the Indian Automobile Industry.
- Production of fuel-efficient vehicles to conserve scarce resources.
- Production of large number of motor vehicles which was necessary for economic growth.
Current Scenario
The four-wheeler segment has shown excellent growth in 2003-04 with total sales, domestic and abroad crossing the one million mark. During this period, the automobile industry registered a growth of around 16.5% in sales and 24% in value.
The main contributors to the export market sales were Maruti Udyog, Hyundai Motors and Tata Motors.
Maruti Udyog recorded a 38.4% yoy growth in sales to 39,838 units in April 2004, whereas Tata Motors registered a 57.7% growth compared to the same period last year to 24,961 units in April 2004. Mahindra & Mahindra sold 10,345 units in April 2004, an increase of 43% yoy.
Maruti Udyog Limited manufactures 10 models and over 50 variants. The latest offering by MUL is Grand Vitara which is a CBU (Completely Built Units) imported from Japan.
Competitors
Hyundai Motors India Limited
Hyundai Motors are a wholly owned subsidiary of Hyundai Motor Company, Korea's top automobile manufacturer with a gross 1997 sales revenue of $8.24 billion, against a sale of over 1.2 million vehicles. They are here to meet the dreams and aspirations of the Indian people, to revolutionise the concept of driving, by launching cars that bring the latest in automobile technology to the Indian roads. Hyundai Motor India was established in 1996 with a state-of-the-art plant in Irrungattukottai near Chennai, constructed at a total cost of $614 million. Again, with the planned investment of $1 billion by the year 2001 for setting up a hi-tech research and development centre, they have accorded highest priority to the task of making India a global automobile manufacturer in the years to come.
Hyundai Motors has achieved the task of turning our vision of establishing cutting-edge automobile technology-base in the country, with remarkable ease into reality. Its has installed the latest international automobile manufacturing practices at our plant near Chennai to give the consumer the most technologically advanced car, in the world. The company's debut car - the Hyundai Santro has been designed and developed for India. Its factory at Irrungattukottai will be its only worldwide manufacturing base. The factory has an installed capacity to manufacture 1,20,000 cars per annum. Thus bringing economics of scale at full capacity utilisation. It has established in-house capacities to manufacture critical components at our plant. The most important of these are the production lines for engine and transmission. It has the capacity to produce 1,30,000 units of engine and transmission sets in a year, of these lines, including capacity to produce the new Hyundai Alpha-engine for other models in the company's line-up.
Tata Motors
Tata Motors entered the passenger car market in a big way in 1998 with the launch of the ‘all-India’ car, the Indica. The USP of the car is its ‘Indian-ness’. Initially the car suffered from a few glitches but with modifications and the launch of the Indica V2, the perception improved considerably. The other offerings from the Tata stable are the Indigo, in the mid-size luxury car segment and the Tata Safari, in the Multi Utility Vehicle segment.
Indigo has the largest market share in its segment of around 21%. Tata Motors has the second largest service network after Maruti and will be the most dreaded competitor in the long run. Their recent announcement of coming out with a one lakh car has just compounded the threat from Tata Motors.
The Managerial Problem
It is important in any industry to forecast demand so that production and marketing decisions can be taken accordingly. In the case of demand forecasting in the automobile industry in developed countries, it can be done with a lot of precision as the demand follows a linear trend. However this becomes very difficult in the case of developing countries. Linear growth is virtually impossible to observe. There are periods when the actual sales are very different from what was predicted
In the Indian passenger car market, it is important to predict sales with a reasonable degree of accuracy so that one stays ahead of the competition at all times.
Problem Formulation
It is important to forecast sales in order to plan out the production of the cars and in order to minimise inventory. To forecast car sales on the basis of GDP growth and per capita income growth is not very accurate because the data may not be reliable and it is calculated much after the relevant time period.
Thus one way to avoid this ambiguity is to identify other industries or variables which exhibit a similar growth pattern like that of the car industry, for a long time series. The next step would be to derive a relationship between car sales and that industry. The trend in the observed industry should precede that of car sales so that by observing the changes in that industry, it becomes easy to predict changes in car demand with a reasonable degree of accuracy.
Research Problem
The Indian Automobile industry is experiencing high growth rates at present. But since the industry is a developing one, and with competition heating up in the auto sector, there is an urgent need to be able to plan strategies and production based on some accurate forecasts. In the past, various attempts have been made to predict car sales in India but they have not been very reliable estimates. These measures were based on variables like GDP, per Capita income, household consumption patterns etc. Thus there is an urgent need to develop a system, which enables one to forecast car sales with a reasonable degree of accuracy.
Thus, to forecast car sales, one needs to identify the lead indicators, which show a similar growth pattern like that of car sales.
In order to do this one needs to understand the following:
- Is the industry related to car sales in some way?
- How much lead-time is exhibited by a careful analysis of the trends?
- What has been the change in the car sales patterns in terms of end consumers?
- When does a household think of purchasing a car?
- What factors affect the demand for cars?
- Are those factors dependent on each other?
By careful analysis of the above, a fair degree of accuracy can be achieved in the prediction of car sales.
Research Design
The project started with a literature review in order to get an insight into the Indian Automobile Industry. There was also a need to understand the consumer’s buying process to figure out when does the demand for car changes from a latent demand to an expressed demand.
After the literature review, the next step was to identify sectors, which are closely related to car sales and collect long term data for them. Then a visual inspection would help in making a list of all those indicators which are showing similar growth trends like that of car sales.
Next a statistical tool is used to test the significance and the strength of correlation between the two sets of data. Once, the lead indicators are identified, car sales are predicted using the observed values or changes in them.
Introduction
It is important in any industry to forecast demand so that production and marketing decisions can be taken accordingly. In the case of demand forecasting in the automobile industry in developed countries, it can be done with a lot of precision as the demand follows a linear trend. However this becomes very difficult in the case of developing countries. Linear growth is virtually impossible to observe. There are periods when the actual sales are very different from what was predicted.
Although a small proportion of the population in developing countries own automobiles, automobile purchases are important in the total consumer spending. In most developing countries, automobile industry is still at an embryonic stage but they are also given high priority (tariff and other industrial policies are frequently based on them). Knowledge of the ownership trends is also necessary in planning the supply of joint consumption goods such as petrol, in road use projections, and in other aspects of regional and urban planning.
Consequently, forecasting the demand for automobiles is vital to the formulation of consumption, production and other policies in developing countries, but the forecasting methods used in developed countries are inappropriate.
The demand for automobiles in developed economies like that of the USA is primarily a demand for replacements. Although there is some additional demand for second and third cars and the total demand increases with population growth, most families do own automobiles. In forecasting demand the existing stock of automobiles is therefore as important as the income and price factors.
In developing economies, car ownership is still increasing, the stock of automobiles is small, and replacement purchases are less important than in developed countries. Since the automobile is a status symbol as well as a means of transportation, non-economic factors are also important in automobile purchases. The high import component of automobile limits their availability; it cannot be assumed, as in developed countries, that an ample supply will meet the demand in the long run. The construction of domestic manufacturing plants, however, usually raises car prices. Supply is therefore a distinct factor in determining purchases in developing countries.
In both developing as well as developed countries, random influences disrupt the trends. Because of the importance of automobiles in consumption and production, many of the irregularities in the trend are caused by the government policies.
Automobile Demand: A General View
The techniques used in demand forecasting in developed countries are based on sophisticated concepts of demand, income and prices, and in addition take into account problems of depreciation and replacement.
Demand
Traditionally, consumption demand is a function of income and prices, and it is usually divided into two parts: a normal part pertaining to necessities and a discretionary part, which relates to other expenditures. It is therefore the discretionary part, which is important in purchases of consumer durables, particularly of automobiles. Since the discretionary part of the consumption function can be postponed, automobile purchases are heavily influenced by business fluctuations.
While in pure demand theory demand is generally regarded as depending on price alone or on price and national income, in practice other economic and non-economic factors come into play and may be as important as, or even important than, price and income.
Demand for transportation and car ownership
The demand for new passenger car is distinct from an individual’s demand for transportation or for car usage. Using an old car for another year can usually satisfy the transportation demand, while the demand for car usage can be met by purchasing a used car. The following purchases are therefore important in car purchases:
A purchaser wishes either to obtain possession of a new car or to exchange his present car for a new one. While the former predominates in developing countries, the latter is the most important in developed ones. In developed countries where ownership of private cars is widespread, the rate of increase in income is generally one of the least important variables in the demand function. Cars are purchased even without increases in income. In developing countries, the influence of income changes is likely to be more important. A car’s service yield can be measured by the price the a consumer pays for the use of car for one year, i.e. the amount by which the car depreciates by one year, plus the interest foregone by holding capital in the car: the rate of depreciation is determined by a number of factors, the most important being the elasticity of the supply of new cars. In periods of limited supply, depreciation falls and can even be negative. Low depreciation is typical in developing countries where constraints on supply are common; they are not common in developed countries. The interest foregone depends largely on other investment opportunities, and on the monetary situation in general.
In developed countries, depreciation and interest are generally not very important, but in developing countries the may be a means of preserving the real value of one’s money.
Income elasticity of substitutive groups
In developed countries, income elasticity for car purchases is much more than that for food. In developed countries, the income elasticity of a commodity is an increasing function of its price relative to other commodities.
This concept has little application in developing countries. First the average elasticity of food is very high in these countries. Second, the notion that income elasticity of a commodity is an increasing function of its price relative to other commodities probably applies to a very small group of goods, such as the more expensive consumer durables and housing, which are competitive with automobiles. The better the bargains offered in these fields, the less the consumer may be inclined to purchase automobiles.
The concept of the threshold
The income relevant to car purchase is household or unit income rather than per capita income. The threshold depends not only on the amount of disposable income spent on essentials but also on:
- The relative saturation of demand for other durable goods and housing.
- The introduction of new and cheaper models of automobiles.
- Factors such as higher investment in roads, increased urbanization, industrialisation, etc.
J. S Cramer’s pioneering study introduced a median tolerance income M that indicates the level of income (or total expenditure) at which exactly half of all households are motorists.
The threshold can be shifted by installment sales plans. The lengthening of the contract repayment period is expected to lead to an increase in car sales in the long run. The effect is more pronounced in developing countries. Introduction of installment plans transfers automobile purchases from a one- payment “lump” expenditure into a divisible expenditure and thus moves the threshold income downwards.
Relationship between age of car and family income
In 1954, M S Farrell found that the length of ownership of cars is inversely proportional to personal income. In USA, families owning one-year old cars had an income of $7530 while those with seven-year-old cars had an income of $2290. Families without cars had an income of $1729.
The relationship between age of cars and family income is more applicable in those countries where car ownership is already quite widespread.
Personal Income and business income
There is a distinction between acquisition of cars for personal use and for business purposes. In developed countries, the latter accounts for a small and declining proportion of the total use, and car purchases are accordingly unresponsive to changes in business income.
In contrast business use is more important in developing countries. Business activity in the sense of commercial transactions rather than economic growth is therefore an important variable in the demand for cars in developing countries.
Prices
For car owning families, the relevant elasticity is the change in the quantity of new cars bought relative to a change in the used-car prices. In countries where there are many car owners, this elasticity will probably be below unity because a low trade in price will not deter many car owners from replacing their cars. However, in developing countries, where fewer families own cars, a change in used car prices will influence families more strongly, and the elasticity will therefore be quite high. On the other hand, if the supply of cars is insufficient due to rationing, the elasticity may be near zero. No matter how high the prices of used cars rise, families will not sell because they cannot buy a replacement.
Stocks, depreciation and replacement
In the market mechanism, the existing stocks supply the trade-in and used car markets. The prices of used cars trade-in allowances influence a family’s decision to replace its car, but they have only a limited impact on the total stock of cars. Only scrapped cars constitute real replacements, and the increase in stock in any year is calculated by subtracting the number of scrapped cars from the new registrations.
Once a certain level of car ownership is reached, the growth in the stock of cars becomes more and more dampened through the increased number of scrapped cars; this can be shown by calculating the “replacement ratio” i.e. changes in the ratio of scrapped cars to new registrations.
The replacement ratio is also dependent on the average life span of a car. The decreased life span of passenger cars is instrumental in increasing the replacement ratio. The life span of cars is reduced by:
- The additional demands of driving in heavy traffic and parking difficulties.
- The shorter technological life span of new models due to built-in obsolescence
- Increased obsolescence due to higher living standards.
The last factor is probably the most important in developed countries. In developing countries, poor roads and improper maintenance decrease the life span to such an extent that there is probably only a small difference in the life span of cars in developed and developing countries.
Forecasting Methods
The methods for forecasting automobile demand in developed countries can be divided into three categories: complex projection methods, less complex projection methods and simple projection methods.
Complex projection methods involve calculating the threshold of access to motorization and the number of families with incomes above the threshold. The analysis of income distribution data is required.
Less complex projection methods are based on estimates derived by least squares regression. Since both the retail price and the number of new cars sold are endogenous variables, an estimate by least squares gives biased results; nevertheless, the bias is likely to be negligible by comparison with errors in the data.
Simple projection methods can be used after establishing the co-variance between automobile demand and other leading macro-economic indicators. This co-variance has different values at different levels of economic development even among developed countries.
Another simple forecasting method is to calculate the ratio of expenditure on automobile to increments of income.
Automobile Demand in Developing Countries
Model of Automobile Demand in Developing Countries
In all developing countries car owners and purchasers are rich people by local standards, and a car is a luxury purchase. This is particularly true of initial car purchases in a developing country by the very affluent, by large business enterprises and by government authorities, so that prices tend to be almost irrelevant. Large luxury cars purchased and the saturation of this group of consumers is very high.
As cars become more familiar and the road network improves, new and larger purchasing groups enter the market. Their exact nature and size depend on a country’s particular characteristics, but they have some general features in common. There are additional purchases by government authorities and business enterprises (either for personal or business use), high- ranking government officials, business executives and professionals.
As car ownership progresses downward from the very high to moderately high-income group, the price becomes a more important factor. Both price elasticity and income elasticity rise. Smaller cars whose upkeep will entail less expense are bought. Changes in car prices and income levels produce a greater effect. As the income threshold below which a car cannot be bought is approached, and the amount of discretionary income available to the consumer diminishes, the proportion of car owners in each income group alos falls. But the number in each successive lower income group are increasing, and car saturation therefore usually continues to grow at an increasing rate until shortly before the income threshold is reached; then it begins to decline sharply.
As the threshold is reached the market ceases to expand to new, lower income groups. Unless there is a substantial change in the ratio of car prices to incomes, further sales to new customers will depend on:
- Increased ownership saturation within existing groups of consumers
- Additions to the higher income groups as a result of population growth
- Improving levels of income with the result that new groups cross the threshold
- Sales of second and third cars to income units already owning one car
The basic determinant of the income threshold for car ownership is the relationship of car prices(including black market prices in conditions of restricted supply) to income, but social habits are also important. The degree to which cars are regarded as symbols of social and economic status influences the extent to which consumers will purchase them rather than save the money and prefer them instead of other goods and services. In general, patterns of car ownership tend to include owners of medium-sized businesses and professionals but not clerks, blue-collar workers and farmers. The car market in developing countries is thus clearly not a mass market; a country with signs of a mass consumption pattern of cars is becoming a developed country.
Supply factors influence the rate of market penetration in developing countries. When the supply of cars is limited, countries sometimes ration the supply of cars, but more often they adopt indirect methods such as sales taxes, import controls and tariffs, and local production schedules: all these tend to raise the income threshold for car purchase.
Fuel, service and sales facilities, and roads are also of importance in this connection. In developing countries cars are concentrated in cities partly because this is where the high-income groups live, but also partly because cities have roads. Service facilities expand wherever cars are concentrated and so does sales pressure; this is particularly true of instalment plans, which help to lower the income threshold. Service facilities also develop after the first impact of car ownership, since the tendency is for the rate of car purchases to accelerate.
The attention of international car manufacturers is attracted as car ownership grows. Those already marketing cars in a developing country increase their sales efforts, and the others become interested in new market so that sales facilities multiply. The stimulus of expanding sales leads to formulation of government policies on local assembly and manufacture, particularly if there are pressing problems of balance of payments, while the large international companies exert even greater efforts to come in “on the ground floor”.
The lack of alternative transport and other services tends to increase the pressure to purchase cars, and in particular accounts for the high volume of business purchases of cars in developing countries. To a certain extent these purchases represent “fringe benefits” to business and government executives. This is probably more important than in developed countries, but in developing countries businesses frequently have a greater need for cars and other transport and communications facilities than in developed countries.
The business reasons for car ownership tend to be most pressing in periods of rapid economic growth, particularly booms in industrialization; such periods also coincide with a rapidly increasing personal demand for cars. However, as the supply of telephones increases, the rate in growth of business cars tend to decline. The lack of public transport in some cases extends car ownership to clerical and blue-collar workers who purchase cars on the instalment plan in order to travel to work and cover the cost by carrying fellow employees.
Both the supply and demand factors therefore tend to impose a three-stage pattern in the growth of car saturation in a developing country. The first stage is a period of slow growth as cars are introduced in the country through purchases by the wealthy: sales and service facilities are expanded; roads are built. The second stage is a period of rapid growth when car ownership is a reality to a very high proportion of income earners from the wealthy down to the income threshold for car ownership: cars become readily available; business demand for cars is high; the road network is expanded. In the third stage there is a much-reduced rate of growth after the principal market has been established and saturated; sales depend on additions to the upper-income group and on car replacements. India and other developing countries like China are in the second stage of automobile expansion.
A model curve for the saturation of the market for automobiles in a developing country
The model curve focuses attention on the saturation of the car market and on new car sales in the early stages of car market growth when the replacements are negligible. As the market progresses towards saturation, replacements become an important factor and have to be taken into account. Ultimately, as a country’s economy develops and car ownership becomes widespread, replacements swamp car purchases by new consumers. Therefore forecasting methods must be based on replacement models.
Objective of the Project
To identify the lead indicators, which affect the Indian Passenger Car Industry, which can be tracked to foresee the changes in the automobile sector. To predict future trends, a practical and quantitative analysis of these indicators needs to be conducted.
Leading indicators are those variables or industries, which can be used to track changes in a given dependent variable. They are leading in the sense that they move before there is any movement in the dependent variable and once a relationship is established between the lead indicator and the dependent variable, future movements in the dependent variable can be tracked by observing the changes in the lead indicators.
Thus, the objective of the project is to identify the leading indicators for the Indian Passenger Car industry and derive a relationship between those indicators and the demand for passenger cars in India. To predict changes in the demand for passenger cars based on these indicators, a quantitative analysis is required.
Deliverables of the Project
The project entails the understanding of the Indian Car market and identifying the factors, which are responsible for the growth, or are the engine drivers.
Thus the following need to be identified:
- Identify the industry or variables, which exhibit similar growth patterns like that of car sales over a reasonable period of time.
- This can be understood by collating data on various possible indicators, which move with a lead before car sales change.
-
Calculate the strength of relationship between the variables or industries identified and understand the reason for the relationship. Also calculate the lead-time involved in the relationship.
- Conduct a careful analysis of the relationship such that changes in car sales can be predicted by a reasonable degree of accuracy, based on changes in the trends in the car sales.
Methodology
Identify any previous work done in the field - domestic or international. Thus a secondary research was conducted by reading books, journals, articles etc that would give an insight into the features of the car market and help in understanding the peculiarities of the demand for cars in developing countries.
A primary research was also conducted to understand the intricacies, which go into determining demand for cars in the developing countries like India. This would also help in trying to identify the lead indicators for the Indian Passenger Car industry. As part of the primary research various professors from MDI were interviewed and their inputs were used to draw up a comprehensive list of possible lead indicators.
Based on the above inputs, a list of possible lead indicators was identified and data was collected on various variables and car sales. The data was obtained from various sources – Internet as well as specialized institutions and organisations. Thus annual data was collected for various variables and these were then plotted against annual car sales figures.
First by visual inspection, those indicators were short-listed which were exhibiting a similar growth trend like that of car sales but with a lead-time. A hypothesis was drawn up regarding the lead-time involved in the relationship with that of car sales.
This hypothesis was tested using the statistical technique of regression since it was observed that the indicators were showing a good degree of linear relationship with changes in car sales. Thus regression technique was used to test the strength of the linear relationship and identify the lead-time involved. The lead-time was validated by running a regression analysis for various lead times i.e., for the same year, with a lead of one year and so on. The lead-time, which was chosen, was the one, which gave the highest degree of linear relationship as measured by the adjusted coefficient of determination.
Once the indicators were identified using the visual inspection technique and validated using the regression analysis, their collective impact on the car sales was estimated using multiple regression. Thus, arriving at an equation for car sales, and putting in the values of the lead indicators in the equation can predict car sales predicted with a reasonable degree of accuracy.
List of Possible Lead Indicators
-
Housing, as measured by the number of housing loans disbursed by scheduled commercial banks, for different loan categories. The rationale for adopting this was that a consumer would first think of purchasing a house and then consider buying a car.
-
Consumer Durables viz, Sales of TVs, Refrigerators, Air conditioners, Washing Machines etc. These consumer durables along with housing were chosen because they form a large chunk of the expenditure of a household and compete with the purchase of a car.
-
Two Wheeler sales could precede the sales of cars, as 85% of the cars sold in India are compact cars and Maruti 800 is a major player in that segment. It is the lowest priced cars in the Indian market and is considered the entry-level car for any two-wheeler owner. To get a more focused data set, motorcycles were considered especially the relatively more expensive ones. A person buying a high-end motorcycle would have more disposable income than a person purchasing a scooter or a moped and thus would be more likely to purchase a car.
-
Telecommunications was considered as the focus was on the gradual increase in the living standard of the consumer. Thus the premise was that an increase in car sales would be preceded by an expansion of telecom services and their penetration.
-
Capital Expenditure of the Government- this would raise the productive potential of the economy and to the extent that capital expenditure involves purchase of cars, it would lead to an increase in car sales.
-
Infrastructure, especially roads- an improvement in the infrastructure of the economy is known to increase the rate of growth of the economy and thus make the people richer. This would put more money in the hands of the people, which would then translate into higher car sales. The increase in the road network has an additional effect in the sense that it encourages the demand for cars in the economy.
-
Monsoon- it is well established that a good monsoon leads to high growth of the economy by leading to higher agricultural incomes. Since, this increase in income would then translate into higher demand for industrial goods, a good monsoon thus propels the growth rate of the economy.
-
Per Capita final Consumption Expenditure- by studying the increase in per capita final consumption expenditure it is possible to predict changes in car sales when the consumption expenditure approaches the threshold level for car purchase.
-
Spend of Household on Transport & Communication- a household would spend money on transport and communication and this is expected to gradually increase over time till the point is reached where it makes economical sense for a household to purchase a car.
-
Education- an increase in the number of educated people would lead to better jobs for them with more incomes. Thus with the increase in the desire for raising the standard of living and equipped with higher incomes, a spurt in car purchase would take place.
-
Machine Tools- the consumption of machine tools can be taken as a proxy for industrialisation and thus generate higher income levels in the economy.
-
Private transfer of foreign exchange- the remittance of foreign exchange sent by Indians settled abroad would increase the money supply in the economy and increase the disposable income of the people.
The Lead Indicators
Based on visual inspection of the graphs and statistical tests, the following were identified as lead indicators for the Indian Passenger Car Industry:
Machine Tools Industry in India
The consumption of machine tools gives a lead-time of 3 years with car sales. The value of adjusted coefficient of determination between car sales and machine tools consumption, is very high = 0.943324, with a lead time of 3 years.
Characteristics of Market
General Background
The Indian machine tool sector was traditionally a protected industry that did not encourage innovation or production to global standards. The liberalisation of the Indian economy from 1991 led many foreign manufacturing companies to enter the market. Local firms found it increasingly difficult to compete on quality, and required imported machine tools to meet international standards. In addition while India has a large manufacturing base, an insulated outlook and the dependence on sheltered policies from global competition, has put the brakes on.
Also the inability of Indian machine tool manufacturers to adapt to new market conditions, combined with fewer restrictions on imports and lower duty rates (reduced from over 200% to the current maximum 51%), has resulted in a dramatic growth in the import of machine tools. By 1999-00, imports accounted for around 40% of the country s consumption. Engineering growth is difficult to predict or quantify but manufacturing generally accounts for 80% of all India’s industrial output and has grown by a steady 6% to 7% over the last year due to strong domestic consumption. Industry accounts for 27% of India s GDP. Sub sectors such as automotives, paper, food products, rubber and basic metals continue to perform well.
The Indian machine tool industry is dominated by the organised sector, which accounts for around 70% of total production. There are about 450 manufacturers with 150 units in the large and medium scale organised sector. HMT Limited has almost 32% of the market share. Their dominance has on the whole reduced standards to below those required to compete globally. However, the emergence of a number of global quality manufacturers has actually resulted in growth in exports to a number of countries including UK, Switzerland, Germany and the US.
India s machine tool industry operates exists throughout the country. But the hub of the manufacturing activities is focussed in:
- Mumbai and Pune in Maharastra;
- Batala, Jullunder and Ludhiana in the Punjab;
- Ahmedabad, Baroda, Jamnagar, Rajkot and Surendranagar in Gujurat;
- Coimbatore and Chennai (Madras) in Tamil Nadu
- Some pockets in East India and Bangalore in Karnataka.
The major changes in machine tool technology have been influenced from outside rather than inside the machine tools industry itself. The aerospace industry has also had a role to play in this context. The demand for accuracy and the complex requirements of the aerospace sector, together with those demands from ordnance, automotive, telecommunications and others have provided a motivating drive for development and a change in trends in the Indian machine tool industry. There is now a concept of jobbing, batch and mass-production which have necessitated the manufacture of different types of machine tools, ranging from general purpose, metal cutting and metal forming to highly dedicated tools. The Indian machine tool industry is also a provider of conventional machine tools as well as computer numerically controlled (CNC) machines. Indeed the CNC segment is emerging as a possible driver of further growth for India’s machine tool industry.
Current scenario
The economy is now showing signs of recovery, and the machine tool sector is usually the last one to come out of a slowdown, due to deferred spending by its end users and other factors like high excise duties, low import duties and import of second hand capital goods. However, with the revival in fortunes of most industries leading to enhanced derived demand for machine tools a growth rate of 12% was achieved in 2002/03.
The main end users of machine tools are the automotive (30-40%), consumer goods (20%), engineering goods (15%), and railways (10%) sectors. The defence and construction industries are smaller scale users.
The Indian automobile industry had emerged as an engine of growth in India’s economy. But, despite the introduction of many new models, the industry (along with the rest of the economy) suffered a prolonged recession during 1996-99 from which it is now showing good signs of recovery. Notwithstanding the previous gloom, the existence of a number of major collaborations with foreign manufacturers (including Fiat, Toyota, Honda, MG Rover and Mitsubishi) has spawned hundreds of component manufacturers.
The automobile industry as a whole, including the significant 2 and 3-wheeler categories, is projected to grow at an average annual rate of 15% over the next two years. Such growth should be accompanied by a high degree of sophistication and higher consumer expectation in the manufacturing processes required to develop price competitive, environment friendly and safer vehicles to meet stringent standards laid down from 2000. This has resulted in a significant demand for machine tools, especially by the tier two and tier three auto component manufacturers. The Western Region of India and Pune in particular, is becoming a hub of activity and clusters for the automotive and engineering sectors. Moreover, South India has grown into a highly acclaimed manufacturing base due to the presence of a number of auto majors like Ford, Toyota, Volvo and MICO here. In the machine tools segment, there was a slow down but in the past one year or so, there has been a revival of sorts owing to overseas business and this in turn has triggered off a manufacturing revolution.
Engineering design is an area where the South has grown tremendously with Bangalore shaping up as a hub. Engineering design is expected to drive outsourcing of manufacturing. Big engineering companies like Larsen & Toubro have already set up a separate design unit and are trying to utilise it for manufacturing capacities. Sundaram Fasteners, is now looking at process design and wants to migrate to product design over time (Sundaram Fasteners has also signed a memorandum of understanding to acquire Dana Spicer Europe Ltd., located at Cramlington, UK). Bharat Forge (which has acquired a forging unit in Germany recently) has invested heavily in automating its plant machinery using Computer Numerical Control (CNC).
As India continues to progress to meet international standards and to satisfy WTO norms (almost all Quantitative Restrictions were removed in April 2001 in line with India’s WTO obligations), there has been a steady growth in the requirement for more technologically advanced machinery in a number of industries. These include the electrical, textile, pharmaceutical, and food processing and packaging sectors.
Capital Expenditure by the Government
Capital expenditure is spending on assets. It is the purchase of items that will last and will be used time and time again in the provision of a good or service. In the case of the government, examples would be the building of a new hospital, the purchase of new computer equipment or networks, building new roads and so on.
Capital Expenditure of the government gives a lead-time of 2 years with car sales. The value of adjusted coefficient of determination between car sales and capital expenditure, is very high = 0.927122, with a lead-time of 2 years.
Data on the amount of capital expenditures for new plant and equipment and measures of the stock of existing facilities are critical to evaluate productivity growth, changes in industrial capacity, and measures of overall economic performance.
Thus capital expenditure is the investment expenditure of the government and increases the productivity of the assets. The investment in infrastructure also is part of the capital expenditure of the government and contributes to generating income. This increase in income then translates into an increase in the disposable income with the people and given the marginal propensity to consume, determines the amount of income people spend under various heads. The government also purchases cars for officials, military, MPs etc and to the extent that this is counted as capital expenditure, an increase in capital spending by the government leads to a rise in car sales. Thus car purchases increase with increase in capital expenditure by the government.
Private Transfer of Foreign Exchange
Private transfer of foreign exchange by Indians working abroad also contributes significantly towards increase in car sales. Many Indians have been going abroad to work and a lot of them have been settling in foreign countries. However, their families and friends stay back in India. These Indians then send foreign currency back to India. This remittance of foreign exchange then translates into higher incomes in the hands of the people and thus the demand for cars also increases. Every year, lakhs of people emigrate from India in search of better employment opportunities or for business purposes. Most of the income they earn is remitted back to India(in case their families or friends are settled in India).
The private transfer of foreign exchange gives a lead-time of 3 years with car sales. The value of adjusted coefficient of determination between car sales and private forex remittance, is very high = 0.951823, with a lead time of 3 years. Thus , a very good linear relationship is established.
The Final Equation
Thus, it is observed that each of the lead indicators identified has a high correlation with car sales and each of them is individually significant. However, to obtain a combined impact of all these indicators on car sales, we do a multiple regression of all the three lead indicators as the independent variables and car sales as the dependent variable.
Thus the final equation, which is obtained, is the following:
St = a + b1 CEt-2 + b2 Mt-3 + b3 Pt-3 + e
St = Car Sales in year ‘t’
CEt-2 = Capital Expenditure in year ‘t-2’
Mt-3 = Machine Tools in year ‘t-3’
Pt-3 = Private Forex Remittance in year ‘t-3’
‘a’ = 1817.131 = Intercept
‘b1’ = 3.652 = Coefficient of Capital Expenditure
‘b2’ = 14.453 = Coefficient of Machine Tools
‘b3’ = 3.219 = Coefficient of Private Forex Remittance
‘e’ = Error
Thus, the above equation can be used to predict car sales if the values for the lead indicators are known in the preceding years.
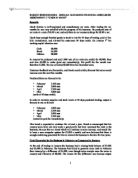
Testing the Equation
The equation was tested for predicting car sales for the year 2003-04. according to the equation, car sales in 2003-04 were 745046. the actual car sales for the same year are 758345. thus the equation underestimated car sales by a figure of 13299 ( error term). This error is only 1.75% of the actual car sales figures for the year 2003-04.
Forecast for the year 2004-05
Using the above equation and the available values for the lead indicators, the car sales are estimated to decline to 6,67,879 with a standard error of estimation of 39,794.
Multicollinearity
However, the lead indicators identified exhibit a high degree of multicollinearity, i.e., the variables are dependent on each other. Thus individually they are significant in the sense that they can explain changes in car sales. But in the statistical analysis of multiple regression, none of them are significant. Thus individual weights cannot be assigned to them on the basis of the equation.
Therefore, individual regression would have to be used in order to get an idea of changes in car sales, if we consider just one of the lead indicators.
Conclusion
Thus based on the work done on the project, the following were identified as the lead indicators:
- Capital Expenditure of the Government
- Machine Tools Consumption
- Private Transfer of Foreign Exchange
The final equation based on the above lead indicators is:
St = a + b1 CEt-2 + b2 Mt-3 + b3 Pt-3 + e
Thus, car sales can be predicted with a reasonable degree of accuracy.
References
- “Automobile Demand in Developing Countries”, by A. G Nowicki
- “The Theory of econometrics”, By H. T Davis
-
- RBI website
- “The Demand for motor Cars in United States” by M. J Farrell
- “The Automotive Industry in Emerging Economies: A Comparison of Korea, Brazil, China and India” by Avinandan Mukherjee and Trilochan Sastry.
-
- UN Statistical Division
-
- NSSO
- CRIS-INFAC
-
“Complete Business Statistics”, by Amir D Aczel, 5th Edition, Tata McGraw Hills Publication
- Central Statistical Organisation
- Centre for Monitoring the Indian Economy, Various issues
- National Housing Bank, Report on trends and progress of housing in India
- Annual Report, Ministry of Labour
- “Handbook of Statistics on Indian Economy”, Reserve Bank of India, Various editions
- Research and Development Statistics 2000-01 & Past Issue, Ministry of Science and Technology, Govt. of India
- UK Trade & Investment – “Machine Tools Industry in India”
- McKinsey & Company – “India Auto Sector”
- “India – An Emerging Automobile Giant” by Sunil Kumar Chaturvedi, Deputy Secretary, Department of Heavy Industries
- ICRA Reports – Various issues