The Failings in the Current System and Approaches
The weaknesses of the current system:
- Not capable of subassembly costing
The current system is only capable of tracing direct cost and allocating indirect cost up to the production departmental level. It became inflexible to adapt when the cost of subassembly is required. The management should also hold partial responsibility of this flaw as they failed in forecasting and planning the business activities. If business strategy (interest in subassembly projects) was properly defined earlier, the management accounting system could have be well-prepared.
- Cost-allocation bases
After the amendments in 1987, personnel costs were allocated to production departments based on headcount, while plant engineering costs were allocated on square feet of production space. The cause-and-effect (or benefit received) relationships between these two cost-allocation bases and respective cost pools are considered to be weak. Examples:
- Benefits and claims (considered to be part of personnel cost pool) are more driven by employee entitlements than headcount.
- Occupying more space does not mean that a particular production department is utilizing more plant facilities, utilities or electrical appliances (considered to be part of plant engineering cost pool).
Furthermore, material support cost pool should not be assigned based on direct labour hours as cost-allocation base due to the absence of cause-and-effect relationship.
- Doubtful allocations
The total overhead cost allocated to VRE is the highest among the four production departments, with about 53% ($ 1,343,609) more compared to the average total indirect cost allocated to the other three production departments ($ 2,543,498). This is mainly because five out of the seven indirect cost pools which allocate costs based on usage, had allocated VRE with the highest percentage of allocations. The management must be able to justify this outcome with rational explanations, especially on the 50% allocation of information services cost pool and 32% allocation of product engineering cost pool, or rather review the special study on production departments’ usage.
The limitations of the approaches:
- Method 1:
Firstly, since it further allocates indirect costs to subassembly level based on the departmental overhead allocation by the current system, method 1 inherits the weaknesses of the current system (as mentioned above). Secondly, using direct labour hours as the cost-allocation base for general, production and material support cost pool is not effective because of weak cause-and-effect relationship. Thirdly, general support cost pool is not homogeneous, for example personnel’s cost driver is headcount while production space drives plant engineering costs.
- Method 2 and 3:
Both method 2 and 3 inherits limitations from the current system and method 1 because the only change in these methods is the technique of allocating the general support cost with the consideration of reciprocal use of support departments. Referring to the results above, step-down method based on dollars charged out allocated $ 2,601,723 to VRE, while step-down method based on number of department serviced and on dollars charged out allocated $ 3,414,581 to VRE. A difference of $ 812,858 where the later is about 31% more than the former! In conclusion, step-down method does not provide a reliable information for decision making as it is heavily dependent on the sequential ranking the support department based on various criteria which is not able to be justified on any basis (uncertainty).
- Method 4:
The weakness of this method lie on the cost-allocation bases for different cost pools. The agreed three cost-allocation bases, namely machine hours, direct labour hours and material dollars are not sufficient to be defined as the cost drivers for all the indirect cost pools due to the lack of cause-and-effect relationship. For example:
- Machine hours do not have strong influence on the cost of information services.
- Final and harness was not allocated with any indirect cost from Information Services, Plant Engineering, Product Engineering and Quality department as it is a purely labour-intensive operation (zero machine hours).
- Cost of “Board 2” for field replacement:
In the study case, the management has not considered the total cost of manufacturing the Board 2 meant for field replacements in the first year contract and its impact on cost allocation. Although it was assumed that the additional cost would only be the direct labour and material cost, but this would greatly change the indirect cost allocations which have direct labour hours and material dollars as the cost-allocation bases. For example:
Producing twice as many of Board 2 as required in completed units would double the cost of direct material, resulting in total of $ 1,99,343.07 ($ 996,715.35 × 2). Consequently, this would elevate the total VRE material to $ 3,211,638.35 and change the percentage of cost allocation as shown in Table 5.
Table 5 New Cost Allocation Percentages for VRE Material Cost and Labor Wages
- Incomplete data
In the case study, production output was not quantified in a clear manner (output-unit-level). This data is paramount important for certain cost calculations. For example:
- To compute the per unit price for complete unit of products or subassemblies.
- Quantity of production output would be a stronger cost-allocation base for Quality department cost because the more output unit to be inspected the more resources is required.
Areas for Improvement
In light of the time constraint, EDD would need to a short term improvement plan in order to submit their bid. Following are suggestions for enhancement:
- Adopt method 4 to calculate the cost of VRE subassembly Board 2. This method yields the highest cost for Board 2; however this method, which employs the activity-based costing model, is believed to be the most accurate among the four for subassembly costing.
- Replace the cost-allocation bases for the following cost pools, if data is available:
- Information services allocated based on usage.
- Plant engineering allocated based on usage.
- Production engineering allocated based on usage.
- Quality department allocated based on output unit.
- Since the old microprocessor is still acceptable, there is no rush to replace all Board 2 in the field in such restricted timeline (one year). The suggestion would be to produce all Board 2 meant for field replacement evenly across the contracted years. The advantage is that the unit cost of Board 2 is more consistent as they share the annually fixed indirect cost. Moreover, VRE might only need to increase labour efficiency to cope with extra work load and do not need to hire additional labour.
As for the long term improvement plans, the following are the recommendations:
- Activity-based Costing (ABC)
The first step that EDD needs to take to refine its management accounting system is to adopt activity-based costing to all products, up to the level of subassemblies. The total overhead cost is 52% of total firm costs and this is regarded as a very huge fraction. EDD may reduce the portion by further studying its indirect costs in detail and classify as many of them as direct cost of the products as is economically feasible. Also, wherever and whenever possible, optimize the indirect cost by improving processes efficiency and resources savings. Lastly, always ensure that the cause-and-effect criterion is satisfied between the cost-allocation base (the cause) and each indirect cost pool (the effect).
- Strategy planning and revenue forecast
EDD management should define their business strategy at the beginning of every financial year along with a realistic revenue forecast and review them on a quarterly basis. This would help to guide the entire company in the same direction and be prepared of the challenges ahead. As such, EDD would not have difficulties bidding for the subassembly contract if this was planned and forecasted in advance.
- Budgeting for cost centres
Understanding the company’s strategy and forecast, a master budget can also be created at the beginning of every financial year and be cascaded down to every department. With the allocated budget, each production, general support, production support and material support departments of EDD will be a cost centre. Whenever resources are utilized by a department, the resources costs are charged to the cost centre of that particular department. This would result in better visibility and justification for cost tracing. Furthermore, comparing the budgeted and the actual cost quarterly and annually would help to measure the performance of every department.
- Indirect labour and material cost tracing
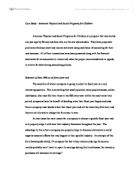
With the introduction of time allocation and purchase requisition processes, indirect labour and material cost tracing can be done easily. All general, production and material support staffs should fill in time allocation form indicating how they spend every working hour. The amount of working hours is then charge to the cost centre of the supported department. A sample of time allocation form is as shown in Figure 1.
Figure 1 Time Allocation Form
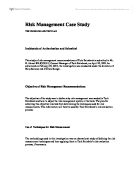
The same concept is applied whenever material, machine spare parts, tools, electrical appliances and others are required by filling in purchase requisition form and charge them to the cost centre of the ordering department. A sample of purchase requisition form is as shown in Figure 2.
Figure 2 Purchase Requisition Form