ANALYSIS/CALCULATIONS
Cost of Equity
The common cost of equity may be calculated using the Capital Asset Pricing Model or the Gordon Constant Growth Model. The Gordon Constant Growth Model requires the expected growth rate in dividends. The case does not disclose the expected growth rate in dividends, so in order to calculate the cost of equity the Capital Asset Pricing Model was utilized. The Capital Asset Pricing Model is defined as follows:
ks = kRF + bs( kM - kRF )
Where the variables are defined as follows:
-
ks is the cost of common equity
-
kRF is the risk free rate of return, and is most commonly measured by the rate of return on long-term U.S. Treasury bonds. The given yield on a 10-year T-bond is 5.697%.
-
bs, beta index, is the relevant risk of particular stock or the risk that the particular stock contributes to a well diversified market portfolio. The Hamada Equation was utilized to calculate the status quo beta (bu). The tax rate was 40% and the debt to equity ratio is 20.9%.
bu = b/[1 + (1 – T)(D/E)]
bu = 1/[1 + (1 – 0.40)*(0.209)]
bu = 0.889
- The levered beta is calculated using the same equation, however the debt to equity is 35.2%. The Hamada Equation illustrates effect that debt has on beta. As calculated below raising debt to equity ratio increases the beta.
bl = bu/[1 + (1 – T)(D/E)]
bl = 0.889/[1 + (1 – 0.40)*(0.352)]
bl = 1.08
-
kM - kRF is defined in the case as being a premium of 7%.
kM = 0.07
By plugging the calculated values for kRF, bs, and kM, in to the Capital Asset Pricing Model the cost of common equity may be determined.
ku = kRF + bu( kM - kRF )
ku = 0.05697 + 0.889(0.07)
ku = 0.1192 or 11.92%
Similarly, the cost of common equity was calculated for the levered situation as follows:
kl = kRF + bu( kM - kRF )
kl = 0.05697 + 1.08(0.07)
kl = 0.1326 or 13.26%
Cost of Long-Term Debt
Cost of Long-term Debt was given in the case as 6.3%
Cost of Preferred Stock
MCI does not have Preferred Stock.
Calculation of the Capital Structure Weights
The capital structure weights are comprised of three components the common equity weight, the long-term weight, and the preferred equity weight. MCI does not have Preferred Stock, therefore the capital structure weights will be calculated only using the common equity and long-term debt.
Market Value of Common Equity
The total market value of the shares of common stock is the product of the current market price of a single share of stock (Po) and the total number of shares outstanding. The market capitalization is given in the case as $18,898,000.
Market Value of Common Equity = $18,989,000
Market Value of Long-term Debt
The total market value of the long-term debt is calculated by determining the market value for all of the company’s outstanding debt. Insufficient data was present in the case for estimation of the market value of the LT debt.
Book Value of LT Debt = $3,944,000
By using the book value of the long-term debt instead of the market value of the long-term debt, the WACC is not as accurate as possible. The usage of the book value of the long-term debt presents a major limitation of the analysis and reliability of the calculations for this case.
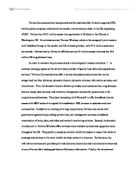
Relative Weights
The table below summarizes the relative weights of the value of debt to equity for each of the alternatives.
Calculation of the Weighted Average of Cost of Capital (WACC)
The weighted average cost of capital (WACC) for MCI is calculated by the following equation:
WACC = (wCommon Equity)ks + (wLT Debt)kLT Debt(1-T)
WACC – Status Quo
WACC = (0.827)(.1192) + (0.173)(0.063)(1-0.40)
WACC = 0.1051 or 10.51%
WACC – Levered
WACC = (0.740)(.1326) + (0.260)(0.063)(1-0.40)
WACC = 0.1080 or 10.80%
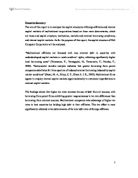
The WACC may be estimated for the other Long-Distance Telecommunications Firms as tabulated below:
The industry range of WACC is 10.44-16.12%. MCI is well with in the industry average WACC. By increasing the debt financing, MCI will slightly raise the WACC and maximize the firm’s value.
EBIT/EPS Analysis
Evaluation for MCI’s senior management was prepared showing a worst case, most likely, and best case analysis for both the current debt undertaking and one that reflects the increase in additional debt. Forecasted numbers were projected from data provided by MCI’s 1995 balance sheet and income statement. See exhibits 4 and 5. Estimation for the scenarios saw the most likely case being represented as the 11.5% increase for projected 5-year growth in EPS. When looking at competitors, the highest 5-year EPS growth rate is 13.5% by Sprint, and the lowest is the 8.5% of Ameritech. An estimation of +/- 2% was used to calculate the best case and worst case, respectively.
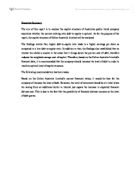
Below are tables depicting these forecasted numbers (All numbers in millions except
EPS):
The only change in these charts that is reflected by the undertaking of more debt is interest expense. Subsequently, the interest expense creates a new taxable income, taxes (approximated at 40%) and net income. Shares outstanding sees a change due to the $2 billion of additional debt being used to repurchase their shares of stock. At a current stock price of $27.75, MCI would be able to purchase approximately 72 million shares. With the reflected changes in net income and shares outstanding, MCI sees an increase in EPS with the new debt. This is due to fewer shares outstanding equaling higher per share earnings.
A graph plotting each option’s EPS against the projected EBIT is depicted below:
The undertaking of new debt appears to be the best option for increasing earnings per share. Buying back a large number of shares allows the net income to spread larger across the shares outstanding.
FRICTO Analysis
A useful tool for evaluating business decisions is the FRICTO analysis, which stands for flexibility, risk, income, control, timing and other factors. With respect to flexibility, issuing a large portion of debt may impede the company’s ability to finance with debt again in the future. Also, by financing the repurchase plan using debt the company will be required to make fixed payments, which also decreases their flexibility. However, there is even less flexibility for the company to repurchase shares if they must wait until corporate funds allow them to do so. Thus, since the goal of the company is to repurchase shares, repurchasing the shares with debt gives the company more flexibility to do so.
When analyzing risk, repurchasing shares with a substantial amount of debt is riskier than repurchasing shares when the company has the income to do so. There is little or no risk in repurchasing shares when corporate funds are available. In addition, issuing a substantial debt carries with it the risk of not being able to repay the debt.
Debt increases the income, or value, because it earns large returns. When analyzing control, financing with debt gives the company more control. The company can use the money as they see fit because it will be readily available to them. If the company waits until it has enough funds to repurchase shares, they lack control over when they can do so. If the company repurchases shares at once they also gain control because there will be less shares outstanding and thus less shareholders.
When considering timing, repurchasing stock with debt allows MCI to repurchase a large portion of stock immediately. On the other hand, an open-market purchase plan has unpredictable timing. Since the company needs to assure their shareholders in the near future, the timing of repurchasing stock with debt is more favorable than simply announcing an open-market plan.
Other concerns that are not considered above include the shareholders’ reaction to substantially increasing debt. They may not react the way that management believes they will to the change in the company’s change in capital structure. By announcing an open-market purchase plan instead, the company would be able to see the reaction from their shareholders before actually moving forward and repurchasing shares. Also, there will be negative effects on the company’s beta, cost of equity and cost of capital.
The chart below illustrates the results of the FRICTO analysis. Using these factors, it is evident that repurchasing stock with debt is more favorable than the open-market purchase plan.
Conclusion
In conclusion, MCI should repurchase shares by substantially increasing the use of debt. By increasing its debt-equity ratio to about double its current level, MCI can increase earnings per share as illustrated by the EPS vs. EBIT analysis. In addition, the analysis of the WACC shows that the increase in the WACC is not substantial and MCI’s WACC remains moderate compared to its competitors. Finally, a FRICTO analysis also backs up the decision to increase debt because it is more favorable in terms of flexibility, income, control and timing.