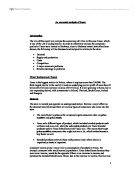
Perfectly Elastic and Perfectly Inelastic Curves
Below are some numerical examples of elastic and inelastic demand:
Example 1 Month 1 Month 2
Price £70 £75
Quantity 105 tonnes 100 tonnes
P = P2-P1 = 75-70 = 5
Q = Q2-Q1 = 100-105 = -5
EP = Q x P1 = 5 x _70_= - 0.67 (EP < 1 therefore demand is price inelastic)
P Q1 -5 105
Example 2 Month 1 Month 2
Price £70 £75
Quantity 40 tonnes 35 tonnes
P = 5
Q = -5
EP = Q x P1_ = -5 x 70 = -1.75 (EP > 1 therefore the demand is price elastic)
P Q1 5 40
The income elasticity of demand (YED) for goods is the percentage change in quantity demanded divided by the corresponding percentage change in income. And it is calculated using the following formula:
The value of YED can be positive or negative. If YED is negative, the goods become inferior and an increase in real income will cause a fall in quantity demanded for the product and vice versa. When YED is positive, the manufactured products are viewed as normal goods. An increase in real income will allow an increase in quantity demanded of the items and vice versa. Normal products can be additionally subdivided into necessities and luxury goods. If YED is greater than zero but less than 1, the products become a necessity. A boost in real income will cause a proportionally smaller increase in quantity demanded of the items, but if the YED is greater than 1 it becomes a luxury good. Therefore, rise in real income will cause a proportionally larger increase in the quantity demanded of the products (Where the numerator is the percentage change in the quantity demanded of good X and the denominator is the percentage change in income) (Anderton 2008:59). Below is a graph illustrating income elasticity of demand:
Cross-price elasticity measures the percentage change in the quantity demanded of good X with respect to the percentage change in the price of good Y and can be calculated using the following formula:
Cross price elasticity of demand can be positive or negative. If the value of cross price elasticity of demand is negative, it would indicate that the related goods are complementary used together. A rise in the price of Y will cause a fall in the demand of X, causing the demand curve of X to shift to the left. If the value of Cross price elasticity of demand is positive, the related goods are a substitute. A rise in the price of goods Y will cause an increase in the demand of X, causing the demand curve of X to shift to the right (Biz/ed 2008). The magnitude for cross price elasticity of demand will indicate how closely related the goods are. A larger magnitude would indicate a stronger relationship between the complements or substitutes, whilst a smaller magnitude would indicate a weaker relationship.
There are many factors which contribute to elasticity within the construction industry. Price is one of the factors, for example, the value of a product and the impact on elasticity within the construction industry. If prices of houses are too high and consumers are unable to afford them, the demand for houses falls and therefore supply falls. This gives no demand to construction industries and will cause a loss in profit. If prices remain high, future profits for these industries look bleak. For example, the construction company would not have many housing projects due to lack of demand.
Income is an influence on elasticity within construction industries; it can be defined as what people earn in return of their work commitment. A rise in income means their demand for most products increase; these are called normal goods as mentioned above in income elasticity of demand. Privately owned housing is an example of this. As average living standards rise, the total demand for housing expands as does the demand for more expensive properties as many people look to ‘move up the market’. This will increase work and demand for the construction company and increase long term profits.
Another determinant of PED in housing is the amount of rent to be paid. Rents are paid monthly or yearly for a property which is owned by another. If rent prices are low, consumers would find it easier to rent for lower cost than buy a house. The cross price elasticity between renting and buying a house is high; renting is cheaper than buying a house. Therefore, the cross price elasticity for houses is low as more people would prefer to rent than buy. However, if rents are raised and consumers are paying lots of money to rent, then in the long run they would be better off buying a house as the bills for renting would add up to total sum needed to buy a house. Low rent would see the construction line without work as there would be people renting rather than buying, but if rents increase then construction line would have to increase supply to meet demand.
If the ratio of income is lower than house prices then consumers would find it hard to own a house. This would result in fewer home owners and less of a need for the construction company to supply houses. However if ratio was greater than house prices consumers would earn more than what is needed to own a house, this would increase demand and supply of houses.
Building materials are also required in order for houses to be built. The more the material costs the more suppliers will charge, all this will add up to total costs of house. However, if costs of building materials decrease, then suppliers will charge less and the cost of housing will be less. The construction company will supply more houses if costs of building material are cheap and vice versa.
As illustrated above, the price elasticity of demand varies with time in which consumers can adjust their spending patterns when prices changes. Therefore, this can be defined as the short term or long term. The short term is the period after the prices change but before a quantity adjustment can occur. Long term is the period needed for complete adjustment to a price change. Its length depends on the type of adjustments consumers wish to make. For example:
A builder’s merchant wants to supply more material to a construction industry due to the rise in demand for building houses. In order for a profit to be made, whilst the demand for housing is high, they would have to accept the supply at a considerable cost. However, this can be avoided if the purchaser were to seek an alternative manufacturer who provides cheaper material or a substitute of that product; this will benefit the business when the elasticity of the demand of ‘building materials’ fall.
In conclusion, from my research and analysis above it shows price elasticity of demand can be used in many different aspects to help a company maximise its profit by taking into account supply and demand. In order for this to occur, it needs to identify if a product is price elastic or price inelastic. If the product is price inelastic then the company can raise its product price, to increase profits, since it will take a big change in price to affect demand. If the price is elastic then the company should reduce its price accordingly, as more people will purchase the product, which in turn will increase revenue. If a product has high income elasticity of demand, over time the demand for it will increase. Conversely, if the elasticity of demand is low, it will remain stable, even during recessions.
List of References
Begg, D, Fischer, S, Dornbusch, R (2005) 8th edn.ed. by Reade, K Economics.
Maidenhead: McGraw-Hill Education
Anderton, A (2008) 5th edn. Economics. Essex: Pearson Education
Microeconomics (2008) 3 comparative statics [online] available from
<http://www.lmu.ac.uk/lbs/epia/people/beachill/referce/mic1ref/top3/compstat.htm#prelast> [1 November 2008]
Spark Notes (2008) Elasticity [online]
Available from
<>
[1 November 2008]
Biz/ed (2008) Cross price elasticity of demand [online]
Available from
<> [30 October 2008]
EconomicsHelp (2008) Cross elasticity of demand [online]
Available from
<http://www.economicshelp.org/microessays/equilibrium/cross-elasticity-demand.html> [30 October 2008]
NetMBA Business Knowledge Center (2008) Supply and Demand [online]
Available from
<> [1 November 2008]
The Theory of Supply and Demand (2008) supply and demand [online]
Available from
<> [28 October 2008]