Misleading questions used to gather statistics could result in misleading statistics. This method is often used when the interviewer wants to distort the reality without being too obvious. In order achieve this, he/she would design the interview questions in a way such that the choices are limited, and yet confusing, thus people are forced to choose the answers that do not match, but best describe their opinions. Based on the two examples above, as a good TOK thinker, when we are bombarded with statistics, it is reasonable to not accept it right away. Yet, we often tend to accept statistics without questioning, because people often have the impression that since the numbers are presented in mathematical manners, the information must be true. Although it is true that numbers don’t lie, people often forget the essence that statistics are interpretations of some kind, thus questions should be raised directly against the publisher. It is extremely crucial for us to establish in mind that the statistics may be used to mislead us for some certain purposes. Therefore, we should always question where the data comes from, the approach of which the data collection was taken, the type of questions asked, and most importantly, whether the person who ran the survey has a reason for contorting the reality.
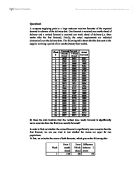
Even when statistics are technically accurate, the method of ‘cherry picking’ could nevertheless garble the reality, because the analysis looks only from a certain perspective, and ignores everything else. For instance, a statistic, which concerns the number of drivers in fatal crashes in 1988, suggests that 16-year-old drivers are safer than of those who are in their twenties1. However, the statistic fails to mention that 16-year-old drivers don't drive nearly as much as people in other age groups. As a result, when the perspective is turned around to looking at the number of fatal crashes per hundred million miles driven, 16-year-old drivers are in fact substantially more dangerous than drivers of other age groups. In this aspect, objective perception is extremely crucial to achieve an accurate analysis. On the other hand, subjective perception would often hide some significant details of the data research, which could totally contrast the reality. Once again, this goes back to the basic problem of whether the interpreter has reasons to twist the reality.
Inappropriate choice of presentation of statistics could nevertheless cause false impression even if the credibility of the data is high. Therefore, it relies on our ability to use our Logic filter to determine whether to accept the statistical evidence. For example, a graph is used to show that the population of Cambodia in 1992 has double from 1957, where proportional sized person figures are used to replace the old-fashioned bars to show the difference. This type of graph can be very misleading to one’s perception, because from the first appearance of the graph, our eyes see an enormous change in the area of the person. We often fail to realize that the height of the person in the only thing that is relevant to this statistical information. Therefore, when associating with graphical statistics, it is extremely crucial to not get carried away by the attractive illustration. Instead, we should pay close attention to what the information is really about before determining whether to acknowledge it or not.
Statistics don’t always have to be presented in the form of graphs, thus the wording of the interpretation could also alter our perception of the reality. A common place where this type of fallacy takes place is in the newspaper headlines. For instance, the Australian Bureau of Statistics released a labor force publication in 1992 with the feature of “An estimated 25% of all families had no family members employed.” Based on this information, a headline of an Australian newspaper ran “UNEMPLOYMENT AFFLICTS ONE IN FOUR FAMILIES”2, which is a totally misleading interpretation of the reality, ignoring all the possible errors that the data itself could have. This is due to the lack of understanding about the definition of “unemployment”. From an economist’s point of view, unemployment should only associate with those who are in the labor force, thus families with no members employed does not necessary suggest that those members are unemployed. From this example, we learn that language is a very elastic medium that the same word could have very different meanings in different ways of knowledge. As a result, in order to present statistics accurately, it is extremely crucial for the interpreter to fully understand the literal definition of some terminologies surrounding the specific issue.
Statistics have the ability to sanitize reality, because they tend to take us away from the emotion and the reality of the subject. For example, statistics depicting increased deaths from the people who have AIDS are not accompanied by photos showing the pains that the patients are going through, nor does it provide the list of names, so they are unable to provide a helpful overview of what the reality really is. As a result, when we see these numerical data, our emotional feelings would automatically become detached. Therefore, even though statistics have a certain degree of validity, it however does not depict the reality.
Statistics are often used by governments to function as a piece of propaganda, in order to maintain emotional supports from the society. A classic example would be the exaggeration of death tolls used during wars for the support of the civilians. Since the civilians themselves are constantly experiencing the loss of families and friends, their perception of the war are associated by their personal experiences and emotional feelings, and thus blinds them from seeing the reality to some extent. When the civilians are provided with statistics which happen to match their beliefs, they are more likely to acknowledge rather than reject the information. Counter to this argument, when same statistics are presented to people who live in cities that are not affected by the war, people are more likely to be rejecting the information.
Despite of the many reasons or methods that statistics can be misinterpreted, they are nevertheless very helpful, in providing evidence to support one side of an argument, or validate a piece of research. To be more precise, statistics itself is a way of knowing, because it makes the reality become visualizing. In fact, statistics plays a really significant role in our everyday life. When we watch sports, we judge on how good the players are according to their statistics. As a result, statistics may be further described as a language, which helps us to express our understanding of the world around us in a different manner. Statistics can be useful because they exist in relationship to previous statistics, which allows people to make comparisons, and draw conclusions on how the factors interact with each other. Even though statistics may be quite accurate, this however does not happen very often in the reality, due to errors and bias. Lastly, even though statistics could possibly be valuable, because they tend to provide a more objective way of viewing an issue, the truth is that subject views due to personal emotions and perceptions are nonetheless inevitable.
Statistics have the potential to represent the reality, but they require our critical reasoning to be finally acknowledged as reliable information. Statistics can be used to serve any agenda by the way the interviewer establishes it, by targeting a reliable response audience, or by designing questions that are guaranteed to reach a specific conclusion. These methods are used to create bias statistics, to establish a series of false impressions of the reality. Thus it depends on our logic skills to determine the credibility of statistics before accepting them. When given statistics, it is also crucial to be as objective as possible, and not get our emotions involved, because this is could introduce bias and completely alter our way of viewing the reality.
Word Count (1671)
Footnotes
1 Lori Alden. Statistics Can Be Misleading. ()
2 Information—Problems with Using. ()
Bibliography
Lori Alden. Statistics Can Be Misleading. 23 September 2005 ()
Information—Problems with Using. 23 September 2005 ()