“Data can be presented in three forms: text, tables and figures” (Williams and Wragg (d), 2004 p.102). Figures are used to establish trends and patterns, although they can be very misleading if not interpreted incorrectly; regularly the title is not specific to the results in the figure and so the viewer does not know what they are actually looking at; the scale of units can be manipulated and may cause the viewer to misread the results (h2g2, 2003) (see Appendix 4). William and Wragg ((e), 2004) and Simon ((a), 2009; (b), 2009) claimed that there are four main figures that can be used in statistical analysis, these include bar/column charts that are used to establish the difference between variables; scatterplots to determine the correlation between two variables; pie charts to view the relative portions through percentages amongst variables; and histograms are used to review and display a rough estimation of the frequency distribution of the process data set.
“Statistics should be interpreted with caution as they can be misleading; they can both lie and tell the truth.” (Joey0744, 2008). The truth and lies can both be uncovered in one finding on statistical research: the question to ask is what is the data being compared to and are the comparisons relevant and valid to the research. Thus, a study may show that gun crime is higher in New York than in London. Evidently this claim is true as it would be stated clear in a table to show the figures; however this study does not take into account the reality that New York laws allow the handling of firearms, whereas United Kingdom laws do not allow the handling of firearms. Therefore the results of this study would show to be misleading as it had not been compared to a city/state similar. To prevent a built in bias the researcher should have carried out the study against another state similar to New York.
It can be said the many researchers carry out studies with a built in bias to persuade the audience to one side. For example, with the debate of whether smoking causes cancer, many studies have been carried out; Martin (2005) claims that smoking causing about ninety percent of lung cancer deaths in males and virtually eighty percent of lung cancer deaths in females. The question to ask here is who was being studied? Did the researcher ensure the study was high in internal validity; the researcher may have been very selective in their sampling process, and only studying individuals who smoke and have lung cancer, or ensuring that there was more smoker and lung cancer suffers that those without lung cancer. Therefore this study would not represent the population as a whole, only the population that the study was taken upon. Percentages must not always be trusted as the viewer will not know if only ninety percent of male smokers with lung cancer and eighty percent of female smokers with lung cancer asked; if this claim is true then the statistics would prove to be right that out of the ninety percent of males asked, ninety percent did have lung cancer. Therefore this test would have lead to the creation of artificial sampling conditions that do not reflect the population as whole, which can be known as low external validity, producing misleading results (Ellis-Christensen, Date Unknown; Taflinger, 1996; Williams and Wragg (a), 2004; Williams and Wragg (b), 2004; Williams and Wragg (f), 2004).
“Garbage in, garbage out” (h2g2, 2003). When reading research, the interpreter must remember that statistics can be found to support just about any idea and in every way of viewing it; the interpreter must ask themselves who carried out the study: someone for or against the hypothesis? If the question was specific then it is likely that the statistics are correct, however if the question was vague then no meaningful information can come from the raw data (h2g2, 2003; Taflinger, 1996). For example, a question of “What female running trainers are better? Asics or Reebok?” can provide misleading results, as this question is very unspecific. The question does not state whether it is referring to the how comfortable the trainer is, the design, colours available, price, performance etc. Therefore the statistical analysis of this data will be deceptive as it is not identifying any specific factor.
Gratton and Jones ((b), 2004) stated that there are four techniques in sampling for statistical analysis, these include random, stratified random, cluster and systematic. Each technique will be preferable to the specific aim of the study and population groups required, with random sampling being the ideal technique as it provides a representative sample of the population as a whole. However all four of the techniques can result in misleading statistics if not performed with care; more information on what each of the techniques entail can be found in Appendix 2.
Small samples can have a significant effect on the analysis, as one negative change in a sample or one piece of data can completely change the outcome. When presenting data from small samples, the mean can be affected by an outlier; for example if the deviation from the mean is not taken into account, a set of results may all be close to fifteen, with just one number at forty-nine or four, then the mean will not reflect the true results, therefore being misleading. Larger sample sizes are more desirable, reflecting what the range within the population is likely to be, as larger samples are less likely to produce a single error that will affect the analysis, whether it is due to a technician error, equipment error, learning effect or biological variance (see Appendix 3). A drawback of large samples is that testing the median will not always be reliable, as it may not be representative of a true average of the scores as it cannot account for a large data range (A.H.R.Q., 2003; Gratton and Jones (c), 2004; h2g2, 2003).
Many factors must be taken into account when viewing and researching statistics, as although figures do not lie, people know how to lie through figures. When reviewing data, four questions must be asked: Who carried out the study? Who was being studied? Where was the study taken from? What is the data being compared to? If the viewer is unsure whether the statistical analysis, they may choose to carry out research themselves to compare their own findings to the original study, or to get a second opinion from a statistical analyser, professional in that area of the study or the author of the study.
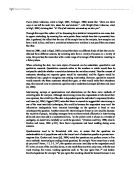
Appendix 1 – Example of how an association between two variables is not evidence that one causes the other
When people chose a gym to attend, they will mostly choose the one with the lowest monthly fees, as people like encouraging numbers to back up a decision. Although the figures prove to be best for one gym, it statistic does not state other factors that may persuade an individual towards one company, such as a compulsory joining or cancellation fee, extra class costs, employee/environment friendliness, facilities, opening times or any extra costs for peak times. People will make the assumption that because that specific cost is advertised, then it is the best available deal at present; statistics are misinterpreted most commonly by people who do not understand how to read them.
Appendix 2 – Sampling Techniques
Random sampling involves every member of the population having an equal possibility of being selected for the study, providing the most reliable results for analysis.
Stratified random sampling is used if only certain subgroups in the population are requires; for example if a study was to be undertaken on how often children in school years five to six in public schools, and children in school years five to six in state schools play on a computer console in a week, then stratified random sampling can be used to prevent children from school years reception to four and school years seven and above being studied; this method will ensure that only the required populations are studied, reducing timescales and possible expenditure.
Cluster sampling samples groups at a random selection, rather than individuals. For example, a study to find out the attitudes towards intimidatory behaviour in under sixteen netball league could use cluster sampling. Random teams would be selected, and all the players in each selected team would then be studied, rather than selecting a random sample of individuals from the under sixteen netball league. By performing the study in this way, the researcher would be able to identify any relationships between the teams, their position in the league and their attitudes towards intimidatory behaviour and reasons why.
Systematic sampling samples the population in a specific systematic method. For instance, instead of questioning every player in the league, the researcher can use systematic sampling to question every third and eighth name from the list, depending that the names on the list are in random order (Gratton and Jones (b), 2004).
Appendix 3 – Possible Error Techniques
Technician error refers to the reliability in the technique of the person researcher, and as the experiment increases, the results become more unreliable (Williams and Wragg (c), 2004).
Machines may produce different results for two identical samples, resulting in misleading results through equipment error; when using machines to record data, the machines must always be tested against a known constant before each use. For example, if weighing scales are the measurement machine, a fixed weight such as a five kilogram dumbbell can be used before each test to ensure that the machine is working correctly, providing identical results for the identical sample (Kose et al., 2007; Williams and Wragg (c), 2004).
A test of human performance will almost always portray the learning effect. For example, the more the respondent carries out the technique or strategy, the more they will improve each time, although it can be unrelated to the concept being tested. An example of this is the Cooper Run where aerobic fitness is tested; however the respondent may improve their performance through learning to run at an optimal pace throughout the process, and although their aerobic fitness may be the same, their performance will increase. To try and prevent this error occurring, the researcher should allow the respondent to become familiar of the study by practising the Cooper Run before being tested (Williams and Wragg (c), 2004).
Biological variance needs to be controlled by managing certain conditions relating to the subjects, due to biological processes that occur within the human body. For example, body weight varies throughout the day, depending on diet and fluid intake; the time of that day the test is conducted can be controlled or the diet and fluid intake of the subject can be measured to help prevent biological variance creating error in the analysis (Williams and Wragg (c), 2004).
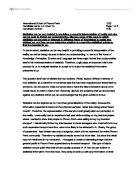
Appendix 4 – Figure Scales
(Give Blood (a), 2009)
This chart can be very misleading as although the figure has a key chart to the side, stating the exact measurements, the axis are not labelled and so the viewer will not know what measurement the stock levels are being calculated in.
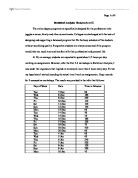
Total Stock
(Give Blood (b), 2009)
The “Total Stock” figure uses a very large scale, using 5,000 gaps in between the “y” axis creating misleading results. If the chart was to add more numbers on the “y” axis, such as the numbers increasing each time by 2,000 then it would show the total stock in a clearer view. The chart’s axis are also not labelled, as before and so the viewer still will not know what measurement the stock levels are being calculated in.
References
Agency for Healthcare Research and Quality. (2003) Talking About Statistics. [Internet] Available From: < http://www.talkingquality.gov/docs/section3/3_3.htm> [Accessed 21/04/2 009].
Bonoma. (1985) In: h2g2. (2003) How To Understand Statistics. [Internet] Available from: < http://www.bbc.co. uk/dna/h2g2/A1091350> [Accessed 21/04/2009].
Eggert, M. (2007) Introduction. In: Perfect Interview. London, Random House Books, pp.2-3.
Ellis-Christensen, T. (Date Unknown) Can Statistics be Misleading? [Internet] Available from: < http://www.wisegeek.com/can-statistics-be-misleading.htm> [Accessed 22/04/2009].
Fontana, A. Frey, J. H. (1998) In: Gratton, C. Jones, I. (f) (2004) 9 Collecting Data II: Research Interviews. In: Research Methods and Sport Studies. Oxon, Routledge, p.143.
Give Blood. (a) (2009) Stock Level on 28 Apr 2009. [Online Image] Available From: < http:/ /www.blood.co.uk/StockGraph/stocklevelstandard.aspx > [Accessed 28/04/2009].
Give Blood. (b) (2009) Total Stock. [Online Image] Available From: <http://www.blood.co.u k/StockGraph/stocklevelstandard.aspx > [Accessed 28/04/2009].
Gratton, C. Jones, I. (a) (2004) 2 Research Traditions. In: Research Methods and Sport Studies. Oxon, Routledge, pp.21-22.
Gratton, C. Jones, I. (b) (2004) 7 Research Designs For Sport Studies. In: Research Methods and Sport Studies. Oxon, Routledge, pp.101-102.
Gratton, C. Jones, I. (c) (2004) 7 Research Designs For Sport Studies. In: Research Methods and Sport Studies. Oxon, Routledge, pp.104-105.
Gratton, C. Jones, I. (d) (2004) 8 Collecting Data I: The Questionnaire Survey. In: Research Methods and Sport Studies. Oxon, Routledge, pp.125-126.
Gratton, C. Jones, I. (e) (2004) 9 Collecting Data II: Research Interviews. In: Research Methods and Sport Studies. Oxon, Routledge, pp.142-143.
h2g2. (2003) How To Understand Statistics. [Internet] Available from: < http://www.bbc.co. uk/dna/h2g2/A1091350> [Accessed 21/04/2009].
Joey0744. (2008) Statistics Should BE Interpreted With Caution As They Can Be Misleading; They Can Both Lie And Tell The Truth. [Internet] Available From: < http://ww w.oppapers.com/essays/Statistics-Interpretedcaution-They-Can-Misleading-They/178527> [Accessed 21/04/2009].
Kose, F. Budczies, J. Holschneider, M. Fiehn, O. (2007) Robust detection and verification of linear relationships to generate metabolic networks using estimates of technical errors. BMC Bioinformatics. 8 (1) p.162.
Martin, T. (2005) Cancer Statistics. [Internet] Available From: < http://quitsmoking.about.co m/od/tobaccostatistics/a/cancerstats.htm > [Accessed 22/04/2009].
McWalters, P. (1999) Technical Brief on the 1999 Statistical Model. [Internet] Available from: < http://www.infoworks.ride.uri.edu/1999/techbrief/techbrief_8.htm> [Accessed 21/04/ 2009].
Simon, K. (a) (2009) Histogram. [Internet] Available From: <http://www.isixsigma.com/libr ary/content/c010527c.asp> [Accessed 24/04/2009].
Simon, K. (b) (2009) Bar Chart. [Internet] Available From: <http://www.isixsigma.com/libra ry/content/c010527b.asp> [Accessed 24/04/2009].
Taflinger, R. F. (1996) The Problems with Statistics. [Internet] Available From: <http://www .wsu.edu:8080/~taflinge/evistats.html> [Accessed 24/04/2009].
Williams, C. Wragg, C. (a) (2004) 2 Literature Review. In: Data Analysis and Research for Sport and Exercise Science. London, Routledge, pp.25-26.
Williams, C. Wragg, C. (b) (2004) 2 Literature Review. In: Data Analysis and Research for Sport and Exercise Science. London, Routledge, p.30, 33, 35-36.
Williams, C. Wragg, C. (c) (2004) 2 Literature Review. In: Data Analysis and Research for Sport and Exercise Science. London, Routledge, pp.35-36.
Williams, C. Wragg, C. (d) (2004) 8 Presentation of Data. In: Data Analysis and Research for Sport and Exercise Science. London, Routledge, p.102,
Williams, C. Wragg, C. (e) (2004) 8 Presentation of Data. In: Data Analysis and Research for Sport and Exercise Science. London, Routledge, p.105.
Williams, C. Wragg, C. (f) (2004) 8 Presentation of Data. In: Data Analysis and Research for Sport and Exercise Science. London, Routledge, p.115.
Williams, C. Wragg, C. (g) (2004) 8 Presentation of Data. In: Data Analysis and Research for Sport and Exercise Science. London, Routledge, p.118.
Wright. (Date Unknown) In: h2g2. (2003) How To Understand Statistics. [Internet] Available from: < http://www.bbc.co. uk/dna/h2g2/A1091350> [Accessed 21/04/2009].