Cost structure of the firm
A firm’s cost are divided into fixed costs and variable costs. Fixed costs consist of pre-committed outgoings, which are payable regardless of the level of output. Variable costs represent outgoings, such as materials, energy and distribution costs, which rise and fall in accordance with the volume of output. Fixed costs can be subdivided into sunk costs and other fixed costs. Some costs refer to past expenditure on fixed assets, which have no alternative use and the cost of which can be amortised or recouped only by trading. Examples of sunk costs include the costs of a nuclear power station and large steel plants. By contrasts, the cost of the lease of an office building is a fixed cost, but is not a sunk cost, since the building could be sub-let to another firm. Sunk costs play an important role in determining the firm’s output and price strategy. Overtime, all costs except sunk costs become variable. In economics jargon, the long run is defined precisely as the period of time over which fixed cost can be converted into variable cost.
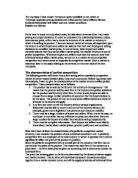
The cost structure of a firm is illustrated in figure 1.1 bellow. Costs are measured on the vertical axis and level of the firm’s output on the horizontal axis. Fixed costs have to be paid regardless of the level of sales and are depicted by a straight horizontal line. Total variable costs are shown as a upward-sloping line, reflecting the fact the variable cost are a positive function of output. Thus, a rise in output of 500 units to 600 raises the total cost from £10 million to £12 million. The variable incurred in adding 100 units of output amount to £2 million.
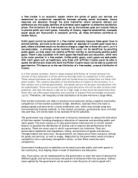
In calculating the contribution of a new product to profits, variable costs are sometimes assumed to be linearly related to output (i.e. they are assumed to raise by constant amount per unit of output). The Breakeven chart, for example, includes information on costs and revenues, and depicts a situation where a certain minimum level of sales is required for the firm to break even (figure 1.2). After this point, the firm enters the profit zone, with profits being calculated as constant contribution per unit. Breakeven charts are used to estimate the effects of profits of variations in sales volumes around the breakeven point.
The breakeven chart is graphic representation of the relationships between costs, volume and price and shows the effects of short-run variations in output upon a firm’s profitability. A typical breakeven chart might look as follows:
Total fixed costs (FC) are constant over a range of output, while total variable costs start at zero when output is zero and increase with output thereafter. Total costs (TC) are the sum of fixed and variable costs. Since selling process is constant, the total revenue (TR) line starts at zero and increases proportionately with output and sales volume.
The firm breaks even (makes
The monopoly market
The world, of course does not consist of perfectly competitive industries. In the paragraphs below is presented a model of a monopoly business and discuss how a monopolist decides what prices to charge and how much to produce.
A pure monopolist is defined as a single supplier for a good or service for which there is no close substitute. In short, one firm constitutes the entire industry. Such a definition of monopoly could be applicable to small business or a company selling on a nationwide basis. As I have suggested, in a monopoly market structure, the firm (the monopolist) and the industry are one and the same. Care is needed, therefore, when identifying a monopoly for the more narrowly a product is defined, the more easily one is able to come up with a monopoly situation. For example, considering a small town with a single newspaper. By the definition given above the owner of the newspaper is a monopolist. The owner sells the only newspaper printed in the locality. What if this product is considered – the only local newspaper as part of the news media industry? Do the owners of the newspaper have a monopoly in all news media? Certainly not, for they are in competition with radio television, magazines, newspapers from nearby towns, as well as national newspapers. Thus the uniqueness of a monopoly is indeed one of degree and few monopolists are likely to face no competition at all.
It is known that a seller prefers to have a monopoly than to face competition. In general, we think of monopoly prices as being somewhat higher than competitive prices, and of monopoly profits as being higher than competitive profits (which are in the long run merely equivalent to a normal rate of return). For a firm to obtain a monopoly in an industry, basically, there must be barriers to entry that enable firms to receive monopoly profits in the long run. We define barriers to entry as the difficulties facing potential new competitors in an industry. The sorts of difficulties that may occur are discussed below.
Barriers to entry
For monopoly power to continue to exist in the long run, there has to be some way in which the market is closed to entry. Either legal means or certain aspects of the industries technical or cost structure must somehow prevent entry. Below, is mentioned several of the barriers to entry that have allowed firms to reap monopoly profits in the long run.
Lack of availability of inputs
Preventing a newcomer from entering an industry is often difficult. Indeed, there are some economists who contend that no monopoly acting without the government support has been able to prevent entry into the industry and unless that monopoly has had the control of some ‘essential’ natural resource. Considering the possibility of one firm owning the entire supply of a raw material input that is essential to the production of a particular commodity. The exclusive ownership of such a vital resource serves as a barrier to entry until an alternative source of the raw material is found or an alternative technology not requiring the raw material in question is developed. A good example of control over vital input is the Aluminium Company of America (Alcoa), a firm that prior to the Second World War controlled the world’s bauxite, the essential raw material in the production of aluminium. (Such a situation is rare, though)
Government regulations and exclusivity agreements
In many industries it is illegal to enter without a license provided by the government. For example, in the United Kingdom you could not operate an unlicensed postal service or radio service. Similarly, it is necessary to obtain a license from the Independent Broadcasting Authority before you can manage a regional independent television service. Successful applicants will receive monopoly rights to the sale of TV advertising space in their areas for eight years. Since these licenses are not granted very often, long-run monopoly profits can be earned by those firms already in the industry. Historically, TV franchises have been very profitable to own. One franchise-holder described it as a “license to print money”!
An equivalent type of situation was found (in 1989) to exist in the supply of beer. Many brews, especially the largest, were involved in brewing, wholesaling and retailing. In fact, it was estimated that 75% of public houses were owned by brewers. A managed house is a pub run by an employee of the brewer; a tied house is operated by a tenant who pays a rent to the brewer and earns a living from the profit generated by the pub. In both types of pub the brewer-owner is able to restrict the range of beers offered for sale. In other words, competitors are faced with barriers to entry.
A patent is issued to an inventor to protect him or her from having the invention copied for a period of years. At the end of the patent period the patented invention is no longer private property but public property which anyone can copy or reproduce. As one would expect, patent owners jealously guard their interest and try to enforce their exclusive rights. If, in fact, the costs of enforcing a particular patent are grater the benefits, the patent may not bestow any monopoly profits on its owner – the policing costs are then too high.
The development of strong brand names is a common feature of many markets. In the minds of consumers, the dominant brand name is often synonymous with a specific firm’s product. The brand image is taken to represent high quality. Hence it is often difficult or costly for entrants to attract consumers away from the well-known brand, especially as the dominant firm may employ price cuts to deter potential entrants to the industry.
- Problem in raising the necessary capital
Certain industries require a large initial capital investment. The firms already in the industry, according to some economists, can obtain monopoly profits in the long run because no competitors can raise the large amount of capital needed to enter the industry. This is the “imperfect” capital market argument employed to explain long-run, relatively high rates of return in certain industries. These industries generally are ones in which large fixed costs must be incurred in order merely to start production. Their fixed costs generally are for expensive machines necessary in the production process.
Sometimes it is not profitable for more than one firm to exist in an industry. Such situation may arise because of economies of scale. When economies of scale exist, costs increase less than proportionately to the increase in output. If the long-run average cost curve continues to fall as output increases, then a situation of natural monopoly might arise.
Within a natural monopoly the first firm that is established is able to enjoy very low average costs per unit. If it charges a price that reflects this favourable cost situation then no rival firm can threaten its position. It is sure not to be undercut and thus is assured of being a monopolist. The natural monopoly case originally provided a justification for utilities such as water, electricity, gas and telecommunications to be managed by the government: to avoid the problems of unfair pricing.
Privatisation, however, has recently altered this perspective. Nowadays, governments structure the public – private sector divide in ways that encourage natural monopolies to behave as if supply were being provided competitively. This modern phenomenon is justified to some extent by a relatively new model of competition. This model is called the theory of contestable markets. The hypothesis suggests that when there are a few firms in the industry they are forced to price their products competitively because there are fewer barriers to entry.
The demand curve facing a monopolist
How does a monopolist determine how much to produce?
A competitive firm has a horizontal demand curve. That is, the competitive firm is such a small part of the market that it cannot influence the price of its product. It is a price-taker. Each time production is changed by one unit, total revenue changes by the going price, and price is always the same. Marginal revenue never changes: it always equals price, or average revenue. Average revenue is total revenue divided by quantity demanded:
What price to charge for output
How does the monopolist set prices?
The quantity is set at the point where marginal revenue equals marginal cost. The monopolist then finds out how much can be charged, that is, how much the market will bear for the particular quantity (Qm). The demand curve is defined as showing the maximum price for which a given quantity can be sold. This means that the monopolist knows that in order to sell Qm it can only charge a particular price (Pm), because that is the price at which Qm is demanded. This price is found by drawing a vertical line from the quantity Qm to the market demand curve. The price is determined where the line from the demand curve to the price axis; this gives us the profit-maximising price Pm.
The basic procedure for finding the profit-maximising short-run price-quantity combination for the monopolist is first to determine the profit-maximising rate of output, either by the total revenue and total cost method or the marginal revenue and marginal cost method, and then to determine by use of the demand curve the maximum price that can be charged to sell that output.
Price discrimination
In a perfectly competitive market, each buyer is charged the same price for every unit of the particular commodity. Since the product is homogeneous, and since one also assumes full knowledge on part of the buyers, a difference in price cannot exist. Any seller of the product who tried to charge a price higher than the going market price would find that no one would purchase from that seller.
A monopolist may be able to charge different people different prices and/or different unit prices for successive units sought by a given buyer. Either one or a combination of these is called price discrimination. The reason a firm wishes to engage in price discrimination is that, where feasible, such a practice will lead to increase profits.
It must be made clear at the outset that charging different prices to different people that reflect differences in the cost does not amount to price discrimination. This is price differentiation: differences in prices that reflect differences in marginal cost.
We can turn this around to say that a uniform price does not necessarily indicate a n absence of price discrimination. Charging all customers that same price when production costs vary by customer is actually a case of price discrimination.
Predatory pricing and dealing arrangements
Above, the discussion of what constitutes a monopoly began with reference to various difficulties facing potential new competitors. Several aspects were identified and discussed under the heading ‘Barriers too entry’. We now need to add to this list pricing policies and trading arrangements, which can also deter entry.
A monopolist can make life difficult for a potential competitor by setting price at such a low level that a would-be entrant feels disinclined to persist with plans to enter this market. Where a monopoly attempts to protect its dominant position by temporarily pricing its product such that losses are incurred not only by itself but for any competitor, it is said to be practising predatory pricing.
How else could a monopolist protect its position? It could also make life difficult for a potential competitor by trying to deny it wholesalers who might consider distributing the product of a rival firm. Exclusive dealing arrangements with wholesalers such that only the monopolist’s goods are handled can limit the sources of custom for a new firm. Alternatively, those wholesalers and importers who wish to handle the goods of a new entrant may find they do not enjoy such favourable trading terms as other merchants who only stock the monopolist’s goods.
These short-term defences in the form of pricing and trading deals could be contemplated by the monopoly as literally a price well worth paying in order to protect its secure position. Whether society as a whole should view this anti-competitive practise with enthusiasm is quite another matter.
Comparing perfect competition with monopolistic competition
If both monopolistic competitor and the perfect competitor make zero economic profits in the long run, then I ask my self, how are they different?
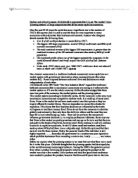
The answer lied in the fact that the demand curve facing the individual perfect competitor is horizontal, that is, the price elasticity of demand is infinity. Such is not the case for the individual monopolistic competitor. The demand curve has some slope to it. This firm has some control over price; it has some market power. Price elasticity of demand is not infinite. The two situations can be seen in the figures below. Both show average total costs just touching the respective demand curves at the particular price at which the firm is selling the product. Notice, however, that the perfect competitor’s average total costs are at a minimum. This is not the case with the monopolistic competitor. The equilibrium rate of output is to the left of the minimum point on the average total cost curve where price is greater than marginal cost (the monopolistic competitor cannot expand output to the point of minimum cost without lowering price; and then marginal cost would exceed marginal revenue.)
It has been argued, therefore, that monopolistic competition involves waste because minimum average total costs are not achieved and price exceeds marginal cost. There are too many firms producing too little output. This situation is described as one of “excess capacity”. According to critics of monopolistic competition, society’s resources are being wasted.
Figure 1.3 (a)
Figure 1.3 (b)
In (a) the perfectly competitive firm has zero economic profits in the long run. Its long-run average total cost curve is tangent to the demand curve dd just at the point of intersection with the marginal cost curve. The price is set equal to the marginal cost, and the price is P1. There are zero economic profits. Also its demand curve is just tangent to the minimum point on its average total cost curve, which means that the firm is operating at its best possible rate of production. With the monopolistically competitive firm in (b), there are also zero economic profits in the long run, because the average total cost curve is tangent to the individual monopolistic competitor’s demand curve, d’d’, at the output where production occurs. The price, however, is grater than marginal cost; the monopolistically competitive firm does not find itself at the minimum point on its average total cost curve.