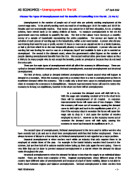
There are arguments for and against minimum wage legislation but does the data show that the minimum wage has the desired effect, or are there obstacles that prevent its success? To try and answer this we can look at the recent experience of the United Kingdom. The National Minimum Wage (NMW) was introduced in Britain on 1st April 1999 at £3.60 per hour. Fig.2 looks at the quarterly data for unemployment from 1992 to 2003 to try and show any trends that might indicate the effect of the minimum wage.
Fig.2
Source: Labour Market Trends: Unemployment Rates - www.statistics.gov.uk
The data is inconclusive in that there are no marked changes as a result of the NMW. The data reflects more than just the introduction of the minimum wage. It is noticeable that the rate at which unemployment is falling is slower after quarter 2 of 1999. This could be a consequence of government intervention to raise the level of wages through the NMW. On the other hand it may be that the rate of change is falling as the economy is nearing its level of full employment. The NMW may be artificially ‘holding up’ the natural level of unemployment. Employers can no longer pay workers cheap wages leaving more people unemployed and unable to occupy low-paid jobs. The higher wages also mean that employers need to make existing staff more productive through training and technology, further reducing the need for more labour. Five per cent unemployment could be the UK’s natural rate of unemployment. If indeed the UK economy is at its natural level then the minimum wage could be keeping that natural level higher than if there were no intervention.
As the results obtained from simply looking at the unemployment trends from 1992 to 2003 are inconclusive, I decided to attempt a simple statistical regression. The model has unemployment as the dependent variable using GDP as a variable and the NMW as a dummy variable (introduced in the second quarter of 1999) can hopefully show the effect of the NMW in numerical terms. Obviously unemployment is affected by other variables but if we expect these variables to be relatively stable then it is the introduction of the NMW that will have the greatest effect. All that can be seen is whether there is a strong positive effect on unemployment after the NMW is introduced.
Using Eviews, the coefficient obtained for the minimum wage dummy variable was 0.495058. This tells us that the impact of the minimum wage has been to increase unemployment. The R squared value of 0.92607 suggests that the model is representative but this may also be due to heteroskedasticity being present in the model. On the basis of this model the NMW has increased unemployment.
Whilst the results of my simple regression were positive showing a connection between the NMW and unemployment, it is unsafe to draw a firm conclusion from the results. This is because it includes too few variables. Even the work of Benjamin Nardella which included a total of nine variables cannot statistically prove the effect of a minimum wage. Most models will confirm a connection between minimum wages and unemployment, but Machin argues ‘the effect of a minimum wage always depends on the assumptions that the modeller makes prior to the experiment.’ A major problem in evaluating the effect of the minimum wage using mathematical models is the lack of data – the minimum wage introduction was effectively a one-off event.
David Metcalf reported for the Low Pay Commission that the NMW actually had a slight positive effect on employment. He mentions that ‘aggregate employment continued to rise around the time the NMW was established and presently there are a record 25 million employees in employment.’ He concluded his report by saying that ‘the evidence – using a rich variety of sources and methods of investigation – suggests that, at the rate(s) set the NMW has not had adverse employment effects.’ Whilst the introduction of the NMW has not prevented these record levels of employment who is to say that they would not have been better still had the NMW not been introduced?
Clearly there has not been a dramatic increase in unemployment. This could imply that demand and supply at low wages are price inelastic meaning that changes in wages will only lead to a small change in labour demand. Reasons for this could be any of the following:-
Although it is illegal to pay workers below the minimum wage, some employers continue to do so. The BBC Website has reported that ‘almost £13 million in unpaid wages has been uncovered from rogue employers since the minimum wage was introduced in 1999’. Although some has been recovered, this information implies that there are many employers that continue to pay wages below the minimum wage. This could help explain the small impact of the NMW and support the argument that the gradient change in Fig.2 is mainly due to the UK reaching its natural rate of unemployment. Admittedly, some employers may be breaking the law but many other employers are not and the NMW should still have some impact upon unemployment.
The impact of the NMW may also have been negated by the strong steady economic growth that the UK has experienced over recent years. Firms would benefit from this in two ways. Economic growth would result in a greater demand for their products resulting in greater revenue, with which they could pay the higher wages. Economic growth also means that the higher wages are not as great in relative terms. This could well help to explain the small impact of the NMW. Had the NMW been introduced during a time of recession, its effect on unemployment may have been much greater.
Rather than shedding labour, an alternative for employers is to reduce the overall working hours of their employees. The second report of the LPC (2000) stated ‘a frequently reported response to the minimum wage was a unilateral reduction of workers’ hours by the employer.’ This area is still open for debate but could be another reason why the NMW may not had the expected effect upon unemployment.
Measurement of the precise effect of the NMW is not practical if at all possible. However, the main indication is that the NMW has had little effect on the level of unemployment. The introduction of the minimum wage in the UK came at a time of economic prosperity. Had it arrived during a time of recession the effect of it may have resulted in a completely different picture.
Appendix
1.1 Annual unemployment figures for Fig.2 (quarterly figures included in chart and regression for greater accuracy)
1.2 Results of statistical regression:
1.3 Results of Benjamin Nardella’s regression:
Bibliography
Bized website
Labour Market Trends: Unemployment Rates -
Employment Policies Institute ‘From Welfare to Work. The Transition of an Illiterate Population’
Nardella, B ‘Economics Paper 043’ November 4, 2003 - Variables: minimum wage; money supply; population; real gdp; labour force; inflation; government surplus; consumer price index.
Machin, S ‘A National Minimum Wage: who would be affected and the effect on employment’ (University College, London) Background Paper 1
Metcalf, D ‘The National Minimum Wage: Coverage, Impact and Future’ Oxford Bulletin of Economics and Statistics, 64, Supplement 2002
BBC Website
2nd Report of the Low Pay Commission (2000)
Employment Policies Institute ‘From Welfare to Work. The Transition of an Illiterate Population’
The full results of the regression can be seen in the appendix.
Nardella, B ‘Economics Paper 043’ November 4, 2003 - Variables: minimum wage; money supply; population; real gdp; labour force; inflation; government surplus; consumer price index.
Machin, S ‘A National Minimum Wage: who would be affected and the effect on employment’ (University College, London) Background Paper 1 pp.2
Metcalf, D ‘The National Minimum Wage: Coverage, Impact and Future’ Oxford Bulletin of Economics and Statistics, 64, Supplement 2002 pp.574
2nd Report of the Low Pay Commission (2000) p.105