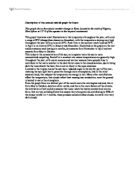
Description of the annual rainfall graph for Kano
This graph shows the annual weather change in Kano located in the north of Nigeria, West Africa at 12° N of the equator in the tropical continental.
This graph illustrates small fluctuations in the temperature throughout the year, with only a range of 8°C (change from January to December), with the temperature staying very high throughout the year with as lows as 26°C. Peak time in the summer reach towards 35°C in April to as lows as 25°C in January and December. Illustrated on the graph are the wet and dry seasons each lasting six months, dry seasons from November to April and wet seasons from May to October.