Risk Assessment
Taking measurements on the sand dune resulted in walking over dunes, and this could cause soil erosion. To minimilise this, care was taken to stick to paths, reducing risk or soil erosion, and damage of vegetation and habitat. The dunes were steep, so care was taken to cross them as safely as possible, as terrain was unpredictable, and rainfall had meant the dunes were boggy.
Data Collected
Secondary Data (Bibliography):
Textbooks- D. Waugh- Geographical integrated approach.
Video- ‘Ainsdale Dunes’
Jonathan Walker (field center manager)
Primary Data:
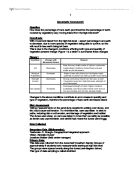
This data was collected from the dune itself (Coatham Sands) Groups of approximately 6 students took measurements starting at high tide level.
The groups were spaced evenly along the dunes (see diagram below)
This type of data sampling is called stratified.
The gradient of the land was taken at every apparent change in gradient.
Measurements taken every 10 m, from 0 m to 150 m from high tide level were percentage bare earth, no. of species, name and percentage of 4 most dominant species and average height of most dominant species, so for this data, 16 measurements were collected.
Measurements taken every 50 m were soil pH, infiltration rate, moisture of soil, wind speed, air temperature and ground temperature, so for this data 4 measurements were collected.
See attached photos (figure 3) for examples of data collection mentioned.
Table of Group 1 Data:
Below is a table displaying percentage bare earth, with increasing distance inland from high tide level:
The data in blue is what I expect to an anomaly.
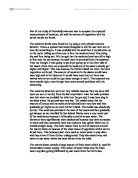
Graph of Group 1 Data
This graph shows that the general trend as distance from high tide level increases, is for percentage bare earth to decrease. My line of best fit goes through most points, however the point at 120m, as expected is anomalous, as it is very far away from the expected value for percentage bare earth here.
The Spearman’s rank correlation shows a strong negative correlation, as when excluding the anomaly, the result is –0.83. The means I can accept the hypothesis that a relationship between bare earth/% and distance away inland from high tide level exists- as distance increases, percentage bare earth decreases.
I have decided to include data from another group, as this will help in seeing see the accuracy, consistency and therefore reliability of results, thus allowing me to draw a conclusion and evaluate my investigation.
Table of Group 5 Data
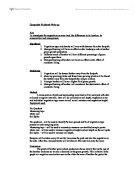
Analysis of Graph
Both lines of the graph show some degree of negative correlation between distance from high tide level, and percentage bare earth (therefore the relationships between percentage bare earth and distance from high tide level is an inverse) however for each set of data, there is an anomalous point (circled on the graph) and also other points which don’t fit particularly well onto the best fit lines. For both lines, there is relatively little decrease in percentage bare earth for the first 10-20m, however after this point, the value drops dramatically, and this is shown by the steep gradient of the graphs (group 1 graph has a slightly steeper drop). However both graphs appear to start to level off, showing the amount by which percentage bare earth is decreasing by is now less. For group 1 data, the line completely levels off after 80m, indicating that at this stage, vegetation is settled with relatively little change in the amount it covers the earth, so therefore there is little change in the percentage bare earth.
Evaluation
My results agree to a strong extent with my hypothesis, as with increasing distance inland, percentage bare earth does decrease, as the amount of vegetation is increasing. However to draw a firmer conclusion applying to sand dunes in general, more data would need to be analysed, e.g. data concerning type and quantity of vegetation, and data taken from a wide range of sand dunes. Despite one anomaly, I can consider the results for this sand dune reliable, as the Spearman’s rank correlation result was close to -1.
However I will now try to explain the anomalies found:
For both sets of data, the main anomaly was for the measurement taken at 120/128 m from the high tide level, and this suggests that as the anomaly occurred at the same distance for both groups, perhaps there is a foot path at this distance which therefore accounts for the sudden increase in percentage bare earth (there will be less vegetation on the footpath, so more bare earth)
Possible Errors:
- Human misjudgment, applicable due to unpredictable weather conditions, inability to communicate easily with other members of group, and difficulty in using equipment accurately, due to rain.
- Certain slacks were moister than normal, so different species were present than was expected, so this may account for the vegetation not being as expected, as this would affect percentage bare earth.
- Some areas were more sheltered from the wind etc than others, so these areas may allow greater growth of vegetation than other areas. These areas appeared to be quite random and unexplainable.
Photo to show technique used to
calculate gradient of the land.