The reasons
The thermal form is dominating the UK’s production because they are the most abundant, accessible resources of energy despite the fact that they are finite. The consumption of course has increased because more electric devices are used and the growth of population means more energy will be needed. There was a drop in the consumption in 2009 mainly because the world economic recession; however bounced back quickly in one year. The production of nuclear power was growing because it only needs comparatively small amount of sources and it produces a relatively high output. The growth, however, wasn’t quite significant because the built-up of a nuclear power plant require a lot of money and in most countries there are not many people who specialised in this area. The growth of nuclear power has further been affected by the incident happened in Chernobyl in 1997. Whereas the production of HEP has been restricted since most commercially attractive and environmentally acceptable sites are already in use.
Chart 2 shows the change in fuel consumption every ten years between 1970 and 2000, and 2011. In 1970, fuel consumption was dominated by solid fuels use (47 per cent of all energy consumption in the UK) and petroleum (44 per cent), with gas contributing a further 5 per cent and electricity 4 per cent. By 1980 the fuel mix had evolved with natural gas making up 20 per cent of all energy consumption in the UK, solid fuels (36 per cent) and petroleum (37 per cent). In 1990, the split between fuels was similar to that in 1980; however by 2000 with changes in electricity generation, natural gas consumption had become the dominant fuel responsible for 41 per cent of all energy consumption in the UK, whilst solid fuels had fallen from 31 per cent in 1990 to 17 per cent in 2000. By 2011 more renewable fuels had entered the energy mix for both electricity generation and bioenergy consumption.
The reasons
The fuel consumption was dominated by coal in 1970s because at that time there were abundant amount of sources and most of them are easily accessible meaning they are not too deep to extract. Also, there were not as much awareness of environmental concerns such as air pollution or the destruction of depleted area. Futhermore, coalmining was the country’s biggest industry. Most importantly, the costs were very cheap. There were not as much gas produced in 1970s partly due to the sources in north sea were not found yet and the prices were higher. The consumption of gas has noticeably increased because the UK obtain the reserves in the north sea and even after reaching its peak the government still encourages small-scale company to deplete the remaining. Additionally, new techniques are also introduced to extract more gas and oil than they could have. Increasing imports of gas also allows higher consumption. The consumption of petrol has remained mainly because the price of oil has remained quite constant and since the UK was an oil-producing country itself, the supply shock will have a relatively low impact on the country’s consumption. The bio energy production increased during 2000 and 2011 because money were put into studies of how to enhance to efficiency of extracting energy from dung, animal wastes or general waste.
The energy pattern in India
In 2009, India was the fourth largest energy consumer in the world, after the United States, China, and Russia. Despite a slowing global economy, India's energy demand continues to rise. As vehicle ownership expands, petroleum demand in the transport sector is expected to grow in the coming years. While India's domestic energy resource base is substantial, the country relies on imports for a considerable amount of its energy use.
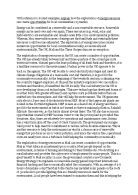
According to the International Energy Agency (IEA), hydrocarbons account for the majority of India’s energy use. Together, coal and oil represent about two-thirds of total energy use. Natural gas accounted for a seven percent share, whereas combustible renewable and waste constituted about one fourth of Indian energy. This share included traditional biomass sources such as firewood and dengue.
Comparing this graph to the previous one, we can see that there has been a significant decrease in the share of combustible renewable and waste, dropped from 37.4 percent to 24 percent. Noticeably, the share of coal production has also increased from 34.1 percent to 42 percent. Other forms such as nuclear power, oil, and renewable have also gone up for approximately 2 percent overall.
The reasons
Coal and oil represent about two-thirds of total energy use because India is an industrialising country and its reliance will be on its natural sources. India has the fourth largest share of coal reserves and is also the fourth largest user at the same time. It is estimated that by 2025 India will be consuming 736 million of tonnes of coal a year.
Natural gas production is expected to grow with the discovery of new gas deposits.
Combustible renewable includes traditional biomass sources such as firewood and dengue, which are used by more than 800 million Indian households for cooking. With rising population in rural areas, the share should increase; however, it decreases. This may suggest the population in rural areas is undergoing a change where there becoming less people in countryside and more people in urban city consuming more electricity that is generated from fossil fuels.
This graph shows the Indian electricity generation by type from 2000 to 2009. The conventional thermal generation has the most significant growth from 400 BKh in 2000 to 600 BKh in 2009, increasing by 50 percent. There is a slight growth in the HEP, nuclear, and other renewable generation over the past 10 years as well.
IEA data for 2009 indicate that the electrification rates for India were 66 percent for the country as a whole. Ninety-four percent of the 404 million that do not have access to electricity live in rural areas where electrification rates are approximately 50 percent. With such increasing demand for energy due to population growth and higher living standard in urban areas, importation will be definitely needed.
To conclude, both countries the UK and India have high reliance on thermal forms of energy and both facing problems with the limited available sources. However, the situation is much more severe in India where in the countryside there are often blackouts. The UK’s consumption is increasing, however at a much slower rate compared to India and this worsens the electricity shortage. The UK’s generation is more or less self-suffient but becoming more relied on importing natural gas whereas in India although they are the fourth largest coal producer, they import many fossils. The future solution may be shifting the reliance on fossil fuel to other forms of energy that is sustainable and renewable or increase the efficiency in obtaining energy.