As acceleration is the rate of change of speed, and that speed is the rate of change of distance (x):
Dividing the equation by m will give
We can get the auxiliary equation:
From this we can get the complimentary function:
TF:
Substituting these values back into
We get:
Putting this into the complimentary function now lets us solve of A and B.
As the paper cups are stationary when time is 0, we know that initially
We get the general solution to be:
Model 2
For this model we assume air resistance to be directly proportional to the speed squared. So air resistance will be
Again, using Newton’s second law, and knowing that the object is moving in a downwards direction we get:
As acceleration is the rate of change of speed
Using the separation of variables method we get:
Where C is a constant of integration
As
So C = 0
As we are looking for an equation which involves x, we have to integrate
When, so d=0
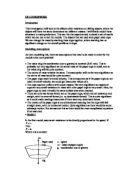
THE EXPERIMENT
Conducting the experiment
We firstly measured out 6 different heights in from the top floor to the bottom floor of the building that we were going to drop the paper cups. We did this experiment in a building to reduce the number of drafts which would cause the paper cups to have sideways motion.
We then allocated people to each of the different heights to time how long the paper cups took to fall to that height, as well as a ‘dropper’ – the person who dropped the paper cups from the top floor. We started off with one paper cup and once the dropper was ready, he would shout ‘ready, steady, GO’, and at that point, all the timers would be started, and as soon as the paper cups passed each point, the timers would be stopped. The times were then recorded and this was repeated six times. We then repeated this for 3 cups and 5 cups.
Experimental Assumptions
We also have to make assumptions with the experiment, as we have to assume what occurs in the experiment is true:
- The paper cups have only downwards (vertical) motion, with no sideways (horizontal) motion.
- All timers start when the dropper signals ‘GO’ and are stop precisely once the paper cups have passed the interval
- The cup always is dropped from the same point
- There is no angular velocity of the cup, and hence no rotation
- The surface area of the cups is unaffected when more cups are added
- There are no external forces given to the cups, i.e. no downwards push
- Cups used are uniform with equal mass
- Initially the cups have no speed
Steps taken to reduce error
There were a few steps that we did to try and reduce the error in the results:
- We repeated the experiment 6 times for 1,3 and 5 cups and took an average time for each distance
- Closed all the doors in the building to try to minimise the drafts
- Chose a dropper who was good at letting the paper cups go as quickly as possible when the timer is started, without giving it a downwards push
Results
1 paper cup:
3 paper cups:
5 paper cups:
The results obtained included some anomalies, which are due to human error, where timers were not stopped accurately (too late or too early). In the data set for 3 paper cups, there are two sets of zero readings at distance 5.39m. This is because one of the timers had an unexpected error with the timer, where the timer failed to start in both occasions, and so, no readings were taken.
TESTING MODEL 1
As the general solution has an unknown constant k, we can now get a value for k using the results obtained. At terminal velocity, the paper cups will have no acceleration. This allows us to find a value for k.
The mass that we use will be the number of paper cups, so for 1 paper cup, the value of m would be 1.
Speed is the distance travelled per unit time
We use the last two values in each of the data sets as the last two readings is when the paper cups are most likely to have reached terminal velocity. The distance of the last two intervals is:
12.94 – 9.07= 3.87m
1 paper cup:
(2 d.p)
3 paper cups:
(2 d.p)
5 paper cups:
12.93 (2 d.p)
As k is a constant, the value of k should have a fixed value. We can see already that the values of k obtained from the 3 different data sets are very different – 6.36, 10.11 and 12.70. This already shows that this is not a very good model to show the relationship between air resistance and velocity. We can demonstrate graphically by taking a mean value for k, to put into the general solution to get an equation for a curve. We then plot this line against the 3 data sets.
1 paper cup:
3 paper cups:
5 paper cups:
From the graphs we can see that the points do not really fit the curve with the equation including the average mean of k. The graph for 1 paper cup shows clearly that the points do not fit the curve, with the points deviating further away. This is because the value of k obtained for 1 paper cup is very far away from the average mean value for k. The graph for 3 cups shows the points fitting quite nicely onto the curve. This is because the average mean (10.083) is very close to the value of k obtained from this data set (10.19). In addition, the graph for 5 paper cups shows the points quite close to the curve (closer than in the graph for 1 paper cup), but still does not follow the path of the curve and deviates away. This is because the value of k obtained for 5 cups is closer to the mean that k for 1 cup. This suggests that is not a very good model to test the relationship between the air resistance and speed, as not all graphs show points which have a trend which is very similar to the curve.
TESTING MODEL 2
We must also get a value for k to put back into the general solution to get an equation.
At terminal velocity,
1 paper cup:
3 paper cups:
5 paper cups:
1 paper cup:
3 paper cups:
5 paper cups:
We can see from all three graphs that the points fit the curve more regularly and follow the trend of the curve. However for the graph for 5 paper cups it shows the points deviating away from the curve very slightly. This is probably down to inaccurate results which could be from both experimental and human error in the results, where the error was carried forward into the average times. Overall, this clearly demonstrates that model 2 is a good r model to show the relationship between air resistance and velocity as all graphs show clear trends and similarities of the points to the curve. We can also see from the error bars that they all intersect the curve, which show that the true point could lie on the curve.
Conclusion
Comparing the two models, we can clearly see that model 2 is more accurate to show the relationship between air resistance and velocity. We can firstly see that in model 1, there are a wide range of values obtained from k (12.93, 10.19, 6.41). However, in model two, the values of k obtained are much closer together (3.41, 3.52,4.19). In addition the graphs from model one show that the points do not really follow the trend of the line, and don’t really lie on the curves (exception in the graph for 3 paper cups where the points do actually fit the line as the value of k for 3 paper cups is almost identical to the man value of k). In model 2, all the graphs show the points fitting the curve more regularly as well as the points following the trend of the curve (graph for 5 paper cups shows the points deviating away slightly, which is probably due to any errors in the data). We can conclude the overall, model 2 is a better model at showing the relationship between air resistance and velocity.
Improvements in experiment
There are many improvements that could be made in the experiment to increase accuracy as well as to reduce any human/experimental errors. We could:
- Use light gates to time the paper cake cups, where the timer is stopped as soon as the paper cups pass the light gate
- Use an automated ‘dropper’ which is linked to the timers, where it starts all the timers simultaneously
- Drop the paper cup in a tube, so drafts do not affect the motion of the paper cake cups
- Conduct the experiment in a closed system, where air pressure, temperature will remain constant
- Take more readings to increase accuracy by taking an average