Richard Price 10B
Used Car Prices:
Coursework
Aim
The aim of this project is to decide which three factors affect the price of a second hand car. I will choose the three factors, which I think, will influence the price the most out of several lines of enquiry.
Introduction
I plan to investigate what factors influence the price of a second hand car. To begin with I had to look at a database of 100 cars. This database gave me a lot of information about each car (e.g. age, air con, mileage etc). All these factors were my lines of enquiry. To choose my three factors I had to decide which three of the eighteen factors would affect the price the most.
Lines Of Enquiry
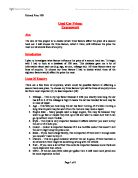
There are a few lines of enquiries, which could be possible factors in affecting a second hand cars price. To choose my three factors I put all the lines of enquiry into a list from most important (1) to least important (18)
- Mileage – This is my top factor because it tells you exactly how long the car has left in it. If the mileage is high it means the car has traveled far and may be in need of repair.
- Age – This tells you how long the car has been running, if it’s been running a long time its parts may be worn from the rust and may need a repair.
- Engine Size – Many people want a large engine, this may be because they want to go fast or maybe they live up a hill and want to make sure that it can go up without much trouble.
- Style – The style is very important because it affects whether you want to buy the car or if it suits you.
- Colour – Colour is important because if it is a horrible colour that doesn’t suit the car it might drop the price a lot.
- Seats – If you have a large family, this is important if there aren’t enough seats you wouldn’t want to buy it.
- Owners – This is a good indicator whether the car is good, if there has been a lot of owners there might be something wrong with the vehicle
- Fuel – If you need a lot of fuel this could be important because some fuels are more expensive than others.
- MPG – If the car does little miles per gallon then it will need more petrol and be more expensive to fuel.
- Air Conditioning – Air conditioning is often looked as an extra feature but cars without can get stuffy.
- Length Of MOT – If the MOT needs to be renewed soon, this is another thing that needs to considerated.
- Tax – Tax is the same as MOT if it runs out soon its another thing you need to pay for.
- Service – Service is expensive so if the car needs a service soon it might affect the price a bit, however I don’t think it will, as it is not that important.
- Doors – Doors won’t really be a big factor, unless you need four doors and a boot.
- Insurance group – This may affect the price but usually if you can afford a high priced car you can usually afford the high insurance group it might have.
- Airbags – It is illegal now to have a car without airbags so this shouldn’t really affect the price.
- Gearbox – Not many people look for the type of gearbox, I doubt this will affect the price.
- Central Locking – This isn’t really a factor looked at by many people.


