A Knowledge of Compression and Tension Forces in the bridge also has to be had so that you can explain why there is no depression in some sorts of
bridges. The top of the bar is under compression because it is being pushed together while the bottom of the bar is under tension because it is being squeezed apart.
I have to know about the atomic structure of possible bridging materials because through these we can explain why different materials depress more than others. This is because the atomic make up of a material determines how flexible the material is and so how much it will sag or depress due to weights.
A knowledge of Parallax Error should be had in the interest of accuracy. Parallax Error is when reading a measurement you look above or below the actual mark and get a wrong reading. This can be avoided by taking the reading at eye-level.
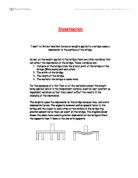
Apparatus and Diagram
The apparatus I intend to us is:
- Two identical wood blocks to simulate the bridge supports.
- Metre ruler to simulate the bridge.
- Two identical triangles to sit on the blocks for the ruler to rest on.
- Weights ranging from .5N to 3N to hang from the bridge.
- Pin attached to the ruler to help read the depression.
- Another ruler with which to measure the depression.
- String to tie around the ruler on which the weights are suspended.
Methodology
The experiment is carried out by
- Set out the apparatus by placing the blocks on a flat surface and then placing the two triangles on the blocks.
- Construct your bridge surface using a ruler and from the 50 cm mark stick on a needle to help you read the depression. Also from this mark suspend a line of thread from which you can hang the weights.
- Set the ruler on top of the triangle so that the 10cm and 90cm marks are on the vertices of the triangles.
- Take your measurement at the weight of 0N. This is the initial depression. This must be subtracted from every reading you take (except 0N) so that you are only measuring the depression caused by that weight.
- Then begin to drop weights from string under the 50cm mark. Begin at .5N and then 1N onto 3N in 1 Newton additions. When measuring the depression always look at the ruler at eye-level to eliminate Parallax Error.
- Fill in your results table for each weight on your results.
- In the interest of accuracy I will repeat the results and from the two sets of results I will make an average.
Predictions
I predict that the results will show that the greater the weight added the greater the depression will be and so the depression in the bridge is directly proportional to the weight added.
Presentation of Results
The results of the experiment would have in a table to be shown as follows:
There are tables showing 2nd and average headings for the interest of accuracy, the readings were taken a second time for each weight and then the average was worked out.
A graph of the results would be as follows: