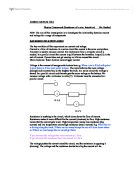
I set the power supply at zero and then increased the voltage by 0.2v, keeping it as accurate as possible using the analogue voltmeter, and also took readings on the ammeter and the C.R.O. I continued to increase the voltage by the same increment and take the individual apparatus readings until I reached 3.0v. Above this value the level of the voltage and current risked damaging the motor, yet by this time I had sufficient results to form an adequate sized list of results and it was therefore not necessary to go any higher.
RESULTS
DATA ANALYSIS
The graph of voltage against current shows one very similar to what I had expected. The trendline shows a near perfect, positive correlation, with only a factor of minus 0.0055 preventing it from being exactly directly proportional. This is most likely due to the fact that I was only using analogue equipment on which readings were hard to get accurate to much more than one decimal place as the scale was small and had to be read by eye. However, one would expect there to be a very close correlation between voltage and current as they vary according to each other.
The graph of voltage against frequency also shows a positive correlation as expected. This would be due to more voltage being supplied to the fan thus increasing its received power and making it spin faster. This would explain the correlation between voltage, current and frequency as more current would be required to drive the fan faster. This is due to the rapidly increasing air resistance as the speed of the fan rises, being due to the squared in KE=1/2mv², so much more energy is required to overcome the effects of air resistance.
There is one anomaly in the seventh piece of data I collected, and this has been highlighted on my graph. Here the frequency reading is too low to fit the sequence, as it is in fact lower than the reading before it in an increasing series.
To further investigate this experiment I decided to look at the relationship between angular velocity and power.
ώ=angular velocity
f=frequency
F=force
m=mass
a=acceleration
r=radius=0.028m
T=time period
P=power
ώ= 2πf f=1/T F=ma a= ώ2r
ώ2=4π2/T2
F=m ώ2r
F=m 4π2/T2 r
P=m 4π2/T r
k=m 4π2 r
P = k/T x=1/T P=kx P ∝ 1/T
This shows that the power of the fan should be inversely proportional to the time period. To attempt to prove this I will plot a graph of power against 1/time period.
(See graph 3)
The graph shows that the power increases as a squared power as 1/time period increases. This does not appear to be inversely proportional and so I plotted a graph of just the time period against power (graph 4). This does show the directly proportional result, showing that the more power with which the fan is supplied, the smaller its time period becomes, meaning it is spinning faster.
CONCLUSION
The pattern of results allows me to conclude that when voltage supplied to the fan increases, so does the current, which was to be assumed anyway.
My first hypothesis was also proven as the frequency of the fan rose with a near direct proportionality as the voltage was increased. This is due to the power also increasing as voltage increased.
I can also conclude that the time period of the fan is inversely proportional to power.
EVALUATION
If I had an accurate digital meter which could have been used for gaining more accurate figure on both the voltmeter and the ammeter, I think that not only could the anomaly have been avoided, but also the graphs may have been perfect straight lines.
There is one anomalous result which has constant and reoccurring effects throughout my experiment. Though I have highlighted this result, and plotted it as separate data to avoid it altering trendlines, if I had had sufficient time I would retake at least the two readings that caused it. In fact accuracy as a whole could have been improved, but that would mean taking more sets of data to keep finding mean results, for which time constraints took control.
In general I think that my experiment has been a success as all hypotheses I set out to determine, and more, have been proven one way or another.