Measuring the e.m.f. And Internal Resistance of a Cell
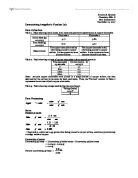
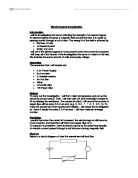
Measuring the e.m.f. And Internal Resistance of a Cell Planning I wish to find out the electromotive force (e.m.f.) and Internal Resistance of a direct current battery cell. Circuit Diagram . Set up apparatus as shown. 2. Use ammeter to adjust variable resistor to vary of currents. 3. Read voltmeter value and record. 4. Disconnect circuit and take e.m.f reading from voltmeter across cell. 5. Repeat for another 9 resistor settings. Use variable resistor and ammeter to adjust the set up to get a range of 0.1 to 1.0A. 6. Repeat entire experiment to get more accurate average. Safety Aspects . Do not have circuit connected up for too long, this will run the battery down and may cause it to heat up and maybe explode. 2. Wear safety goggles and lab-coats during experiment. 3. Follow standard laboratory safety procedures. Apparatus 0 - 1.0A analogue ammeter 2 digital voltmeters 1 variable resistor 1 cell 8 connecting wires. Safety goggles and lab-coat Paper and pen Arranging Evidence Results Current (Amps) Potential Difference (V) 2 3 Average 0.1 .46 .47 .46 .46 0.2 .42 .42 .41 .42 0.3 .36 .39 .36 .37 0.4 .33 .33 .33 .33 0.5 .27 .29 .28 .28 0.6 .24 .23 .23 .23 0.7 .18 .19 .20 .19 0.8 .13 .15 .14 .14 0.9 .10 .09 .11 .10 .0 .04 .03 .06 .04 Using these results I will be able to draw a graph to find the e.m.f.

I hope to find out how resistance of a wire is affected.
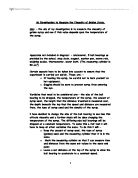
INVESTIGATION TO SHOW THE EFFECTS OF THE RESISTANCE OF A WIRE Aim: - I hope to find out how resistance of a wire is affected. Prediction: - I predict that as the length of the wire increases the resistance will also increase. Scientific Knowledge: - A wire is a bundle of metal strips coated in plastic. The plastic can vary in colour and connect to different terminals These are: - * Black = negative terminal * Red = positive terminal * Blue = neutral terminal * Green and yellow = earth terminal * Brown = live terminal The material varies because it has free electrons, which are able to flow through the wire. The number of the electrons depends on the amount of electrons in the outer energy shell of the atoms, so if there are more or larger atoms then there must be more electrons available. If the material has a high number of atoms there will be a high number of electrons causing a lower resistance because of the increase in the number of electrons. Also if the atoms in the material are closely packed then the electrons will have more frequent collisions and the resistance will increase. Resistance is measured in Ohm's (?). Ohm's Law The law actually says that the resistance of a metal conductor is the same whatever the current - unless it's getting hotter. However most people think of these equations when the law gets mentioned: V = IR V is Voltage in Volts, I
Does An Electrolyte Behave Like A Resistor?
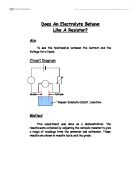
Does An Electrolyte Behave Like A Resistor? Aim To see the relationship between the Current and the Voltage for a liquid. Circuit Diagram Anode Cathode Copper Sulphate (CuSO ) solution Method This experiment was done as a demonstration. The results were obtained by adjusting the variable resistor to give a range of readings from the ammeter and voltmeter. These results are shown in results table and the graph. Results Voltage Current (A) Average Current (V) st Test 2nd Test 3rd Test (A) 0 0 0 0 0 .0 0.14 0.12 0.17 0.14 2.0 0.30 0.26 0.36 0.31 3.0 0.46 0.42 0.52 0.47 4.0 0.67 0.60 0.70 0.65 5.0 0.71 0.83 0.86 0.80 Conclusion The graph is showing a straight line through the origin. This means that as the voltage increases, the current also increases uniformly. A graph of Voltage and Current for a resistor was the same, when I did the experiment. This means that the liquid behaves like a resistor. Which was what we were trying to find out. In a liquid, a current is the movement of ions. In Copper Sulphate (CuSO ) solution the sulphate ions are negative and move to the anode, the copper ions are positive and move to the cathode. The anode is the positive plate and the cathode is the negative plate. If you increase the voltage then the plates become more charged and the ions move around faster, so the
Static electricity and magnetism
Static electricity When materials like silk or polythene become charged with static electricity it is because they are poor conductors or insulators and the electrons stay on the surface. Good conductors like metals allow the electrons to flow away. When the charge builds up it can jump across a gap causing a spark. Static electricity happens in clouds because ice particles rub past each other and build up a charge in the cloud and this charge can jump between clouds or the Earth as lightning. Electric current Electric current is a flow of electrons along a conductor like a metal wire. Electrons come from a source like an electric cell and change places with the metal atom electrons and push the electrons of the metal atoms along the wire. The electric cell gives the electrons energy. Break the circuit and the electrons cannot flow. Electric current is not used up because electrons are not destroyed they transfer energy as they move round the circuit. This can happen in a resistor or light bulb when thermal energy and light energy are given out. Light bulbs produce light because they have high resistance and resist the flow of the electrons. Series and parallel circuits a b In diagram (a) current flows out of the battery through the ammeter and the bulbs, and as the electrons pass through the first bulb some energy is transferred. Then as the electrons pass through

Using a sensor to measure an angle.
Using a sensor to measure an angle A potentiometer or potential divider is a device, which can be used to measure certain type of data. It consists of a moving contact, which can pass along a surface of high resistance. When it does this the resistant output changes and as a result this can be used to measure things, such as distances or angles, as long as the device can be applied to either a rotary potentiometer or liner potentiometer. Current I = V/R V=voltage R= resistance I have researched that radio and hi-fi systems rely on potentiometers to adjust volume levels. On an old radio there is often a scratchy sounds as you turn the volume knob. This is because the signal from the radios is controlled by tapping off part of it with a sliding contact moving along the surface of high resistance. It works by having the signal from the radio - a varying potential difference - across the whole resistance, but the signal to the speaker is then taken from across only a part of the whole resistance. The scratchy noise on an old radio may come from dirt on the surface of high resistance, which briefly spoils the contact as the slider moves. Really top quality hi-fi equipment sometimes uses a chain of fixed resistors in between gold-plated contacts to beat the noise problem Another use for these devises is in car fuel gauges. In a car the fuel gauge doesn't actually measure the
Investigating the factors affecting the strength of an electromagnet.
Electromagnet Investigation Introduction I will be investigating the factors affecting the strength of an electromagnet. An electromagnet produces a magnetic field around the wire, it is made by passing current through a coil of wire. The strength of the field is affected by: * Number of coils * Increased current * Softer Iron core I will see if the electromagnet is more powerful when the current is increased. I will keep all of the factors of the investigation the same, to make it a fair test, this includes the same amount of coils and supply voltage. Apparatus The apparatus that I will require are: * A 2v Power Supply * An Ammeter * A Variable resistor * An Iron Bar * Wires * Crocodile clips * 100 Paper clips Method To carry out the investigation, I will first collect all apparatus and set up the circuit (as shown below). Then I will start with OA and eventually increase to 3A by altering the resistance. The current at which I will record the number of paper clips will be every 0.5 of an amp (e.g. 0 , 0.5 , 1 , 1.5 , 2 , 2.5 , 3). To make the experiment more precise and reliable, I will repeat the investigation so I have 2 results for every 0.5 of an amp, I will then make an average number. Prediction I predict that when the current is increased, the electromagnet will become more powerful, and therefore will hold more paper clips on it. To support my

Investigating Electricity.
GNVQ Science Unit 1 and 3 Investigating Electricity Section A: Voltage, Current and Resistance and Ohm's Rule Firstly, to being this assignment I will be introducing what exactly Ohm's rule is and what voltage, current, and resistance is and how they are measured. * Resistance: - resistance is a measure of the degree to which an electrical component opposes the passage of current. It is the ratio of the potential difference (i.e. voltage) across an electric component (such as a resistor) to the current passing through that component: R is the resistance of the component. If the resistance of a material is low then charges can pass through it easily. (Resistance = Voltage ÷ Current) * Current: - Electric current is the rate of charge flow past a given point in an electric circuit, measured in coulombs/seconds which is named amperes. In most DC electric circuits, it can be assumed that the resistance to current flow is a constant so that the current in the circuit is related to voltage and resistance by Ohm's law. (Current = Number of Coulombs per second) & (Unit of current = Amps) * Voltage: - Voltage is a measure of the energy required to move a charge from one point to another. A difference in the amount of electric charge between two points creates a difference in potential energy, measured in "volts," which causes electrons to flow from an area with more

Investigation in to what happens to the resistance of a thermistor as its temperature changes.
Physics Coursework Danielle Roots Mr Small Aim: To investigate what happens to the resistance of a thermistor as its temperature changes. What is a thermistor? Is a resistor that changes in resistance with temperature. "Its principle characteristic is that their electrical resistance changes in response to changes in their temperature." http://www.betatherm.com/therm_theory.html Symbol for a Thermistor: Calculating resistance Resistance in a circuit can be calculated using the levels of voltage and current in a wire or a single component. The formula we use to measure resistance is: RESISTANCE = VOLTAGE R = V CURRENT I What is Current? Current is the flow of electrons around an electric circuit. It is measured in amps. Current is measured in Amps. amp = 1 coulomb per second Per means divided by so current = charge time What is resistance? Resistance is the measure of how much the current is slowed down. The bigger the resistance, the smaller the current. Resistance is measured in Ohms (symbol ?). What Causes Resistance? [ Parallel Circuits Series Circuits Only has one path for the charges to move along. Charges must move in "series" first going to one resistor then the next. If one of the items in the circuit is broken then no charge will move through the circuit because there is only one path. There is no alternative
Investigating the Resistance Of A Light Bulb As The Voltage Is Increased.
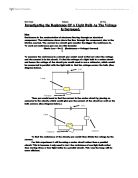
Investigating the Resistance Of A Light Bulb As The Voltage Is Increased. Plan Resistance is the confrontation of electrons flowing through an electrical component. The resistance slows down the flow through the component, due to the friction created. The current in a circuit gets smaller the bigger the resistance is. To work out resistance you can use this formula: Ohm's Law - R= V (Resistance = Voltage/ Current) I To measure the resistance in a circuit you would need to find out what the voltage and the current is in the circuit. To find the voltage of a light bulb in a series circuit and hence the voltage of the circuit you would need to use a voltmeter, which would be connected in parallel with the light bulb to find the voltage across the bulb. (See diagram below). Then you would need to find the current in the series circuit by placing an ammeter in the circuit, which would give you the current of the circuit as well as the bulb current. (See diagram below.) To find the resistance of the circuit, you would then divide the voltage by the current. For this experiment I will be using a series circuit rather than a parallel circuit. This is because I only need to test the resistance of one light bulb rather than testing three or four light bulbs in a parallel circuit. This way the lamp will be more efficient. Safety To make sure that the test is safe, I would
Investigating the factors affecting the size of current flowing through a length of resistivity putty.
04/02/97 ????? GCSE PHYSICS SC1 INVESTIGATION 996/7 INVESTIGATING THE FACTORS AFFECTING THE SIZE OF CURRENT FLOWING THROUGH A LENGTH OF RESISTIVITY PUTTY. CANDIDATE NUMBER 6247 CENTRE NUMBER 15131 PLANNING AIMS The main aim of this investigation will be to investigate the factors that have an effect on the size of the current passing through a length of resistivity putty. I will also try to explain my results using a number of models formulae and theories including Ohm's law, the formula for resistivity and a water model. VARIABLES Below is a list of the variables which are likely to have a major effect on the size of the current passing through a length of resistivity, putty: . The length of putty used. 2. The cross-sectional area of the putty. (Including the amount of contact between the plates and the putty). 3. The temperature of the putty. 4. The voltage across the putty. 5. The resistance of the wires etc. and the contact resistance between the plates and the putty. Other factors, for example the density of the carbon inside the putty, or the pressure at which the experiment is carried out, may also have an effect on the size of the current, however these factors would either be difficult to control in a school physics laboratory or are not likely to have a significant effect compared to the inaccuracies of the experiment. The two