Let Ms be the effective mass of the spring, then;
=()
AND = ( )
By substituting for m in the equation above:
=()
=
=
= +
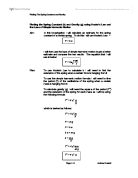
By measuring the extension (e) and the corresponding time period (T) using several different masses in turn, a graph of e against T2 can be drawn as shown below:
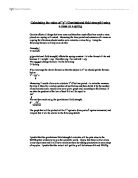
However the value of k can be calculated by plotting a graph of T2 against m.
The value of gradient is used to determine the value of the spring constant (k). By putting the value of ‘k’ into the intercept formula shown below will give us the value of the effective mass.
The value of the gravity can be obtained by using the gradient () of the equation as shown below:
These are all the calculations required to find the value of gravity and the effective mass of the spring.
Measurements
The measurements I will need to make in order to determine the values of gravity are the time period, extension and load added on the spring. To determine the method I will carry out the preliminary experiment. By using the preliminary experiment I will find out the best possible way to determine the time period, this could be done either using a data logger or by using a stopwatch and the best way to measure the extension to reduce the error given. The other possible thing to work out from the preliminary experiment is the amount of load a spring can take before reaching plastic deformation. The preliminary work will also indicate the method that can be used to do the actual experiment.
Preliminary Experiment
The table above shows the results obtained during the preliminary experiment. The original length of the spring was 0.023m. To work out the extension I took the original value of the length away from the measured length when a certain amount of load was added as shown below, To work out the length of the spring I used a meter ruler and the measurements were taken as shown below;
I used the time taken for 10 oscillations to minimise the error and to obtain the time period I divided the values by 10. This gave me a precise answer for the time period, then if you were timing for 1 oscillation. This method reduced a lot of error in my calculation. I will repeat the method when collecting my original results so that any average can be obtained, hence reducing the error even more. Now the main error left is going to be the reaction time of the human when using the equipment. This method is still more accurate and reliable then the alternatives such a position transducer. When using a position transducer the amplitude of the oscillation is limited to a minimum amount affecting the time period for 10 oscillations and the amount of load that can be applied is minimised to 250g, it will limit the values that can be obtained. To sum it up there will an error in the position transducer itself, therefore giving a large amount of error.
The maximum load a spring can hold before it deforms was 1000 g. The spring was completely deformed when an extra 100g was added, therefore it means that the elastic limit is been passed at 1100g. The amount of mass a spring can hold when oscillating, without plastically deforming is 650g. This helps me to decide the range of values of mass suitable for my experiment. As I know that there should be about 10 readings taken to get a reasonably correct answer, I have decided to go up to 500g and going up in 50g. This will enable me to have a wide enough range to base my conclusion.
As I have worked out the above details I think that it would be a good idea if I calculate the human reaction time as it will effect the experiment. The results are shown below:
The table above shows the different reaction times as I tried to stop the stop watch at 30 seconds. The average reaction time is ±0.05 seconds. This will be taken into account when the graph of T2 against e is drawn.
Variables
The only variable in this experiment is mass. I will vary the mass applied on the spring to obtain a range of values for the time period and the extension. The masses will be varied in 50g for every load applied. This means that the masses going up will be 50g, 100g, 150g …………., 500g.
Constants
The spring will be kept the same because different springs will have different lengths, hence producing different extensions. This will affect my graph and will give a value that will not be any where near 9.81ms-2 because the error is increased. Having different lengths of spring will also affect the time period. The greater the length of the spring the greater the time period and vice versa. Every spring has its own value of spring constant (k), this means the value of the intercept will affected as the value of k is involved in the intercept formula. The number of oscillations will be kept constant to 10 so that the error is minimised and the value obtained for the time period is precise.
Safety
Below are some safety precautions for the experiment;
- Do not exceed the elastic limit of the spring because it will break when deformed.
- The hook holding the mass is connected properly to spring, because if the mass falls on someone’s foot it may cause injuries.
- Make sure that the clamp stand is clamped to the table using the G-clamp. If the clamp is not supported the whole system might fall over on someone causing serious injuries.
- Make sure the bosses and the clamps are firmly tightened. As the bosses are holding the spring, if not tightened the spring might shoot out and hit someone’s eye again a serious injury can take place.
- Do not run in the laboratory because you might knock someone’s experiment over and causing yourself and others injury.
Equipment
Method
- Set up the experiment as shown below;
- Measure the length of the spring using a meter ruler and the record the original value. Measurements should be taken without including the loops.
- Attach the hook to the loop on the spring; hook is used to hold the masses.
- Add 50 gram mass onto the hook.
- Measure the length of the spring and record it in the table.
- Calculate the extension by subtracting the original value of the spring from the length above.
- Get a stopwatch and reset it, so it is ready to use.
- Hold the mass up with your palm so that the spring is in its original position.
- Release the spring and start timing instantaneously.
- Divide the time taken for 10 oscillations by 10 to get the time period. Make sure that you time for 10 oscillations because this will minimise the error.
- Repeat procedures 4 to 10, ten times each time adding 50 gram on.
- Record the values in the table, calculating the time period and the extension.
- Square all the values for the time period in order to use the formula below:
By using the equation above draw a graph of T2 against e. Draw lines of best fit and then calculate the value of gravity by using the gradient. Weigh the spring using a top pan balance; make sure the balance is set to zero before start weighing. Weigh the spring 5 times and take an average to minimise the error in the top pan balance. This is the actual mass of the spring.
By plotting the graph of T2 against m a value of k can be found as we know that
The value of k can be used to determine the effective mass of the spring and as theory explains it should be a third of the actual weight of the spring. This will also reemphasise the accuracy of the experiment.
THE EXPERIMENT IS GOING TO BE REPEATED 3 TIMES TO OBTAIN THE AVERAGE VALUE OF GRAVITY.
Results
Experiment 1
Experiment 2
Experiment 3
Average results
I will find the actual mass of the spring to compare it with the effective mass of the spring later in my conclusion I used a top pan balance to weigh my spring. The results are shown below:
The average value of the mass is 0.047 kg. This value will be used in the conclusion to find out if the effective is a third of 0.047 kg as the theory suggests it should be.
Errors
There are two types of errors: -
- Systematic error
- Random error
Systematic error could be caused by incorrectly calibrated scales e.g. cheap top pan balance with low accuracy could have error when reading the values of them. If the equipments are accurate and the systematic error is small we say the measurements are accurate.
Random error, is the error made during measurements, e.g. experimenter doesn’t take the readings properly. Extension of the spring could not be measured by a meter ruler hence equipment not sensitive enough. The experimenter could not stop the stopwatch at the exact time, hence the human error. If random error is very small we say the measurements are precise. Repeating the experiment 3 or more times and taking averages can decrease the random error.
For every equipment I have used for this experiment had a range and an error which are written in the apparatus list.
My error in the extension is the error in the meter ruler and but looking at the apparatus list above the error is ±0.001m. This error is too small to be plotted on the graph of T2 against e. The error in the time period is the error from the stopwatch and the human reaction time. The error from the stopwatch is ±0.0001s, which is too small to be plotted on the graph of T2 against e. The error due to the reaction time is ±0.05 seconds; this can be plotted on the graph of T2 against e. As the error of the human reaction is effecting the time period, it means that the error bars for this error will be drawn on the T2 axis.
Conclusion
I have drawn graph 1 for (Time period)2 against mass and graph 2 of (Time period)2 against extension. From my calculations above I know that the value of ‘k’ can be found from graph 1 as shown below:
The value of m is the gradient and is calculated on the next page:
dy stands for Difference in y co-ordinate = Gradient (m)
dx Difference in x co-ordinate
From graph 1
Now substitute the value of m into the formula above
The value of ‘k’ can now be used to find the effective mass of the spring in the intercept formula. The calculations above also show how to work out the value of gravity as carried out below:
We know,
AND
AND
From graph 2
As I have plotted the error bars, this means I will now need to work out the maximum and minimum gradients along my original gradient. To find the gradient of the minimum and the maximum I will have to find the minimum and maximum points from which I am going to get the gradient. To find the maximum point you add the error to the original point and to find the minimum point you subtract the error from the original point.
Minimum Gradient;
Maximum point = 0.771+0.05 = 0.821
Minimum point = 0.072−0.05 = 0.022
Maximum Gradient;
Maximum point = 0.771−0.05 = 0.721
Minimum point = 0.072+0.05 = 0.122
Original Gradient;
Maximum point = 0.771
Minimum point = 0.072
My value of gravity is 9.38ms-2. According to the published value table, it should be 9.81ms-2. I can see that my value of gravity was out by 0.43ms-2. This enabled me to realize that there is an error in my value of gravity, which I have calculated below:
Maximum error = 10.94−9.38
= 1.56
Minimum error = 8.20−9.38
= -1.18
Therefore the error in the value gravity is +1.56 and -1.18.
As I have worked out the minimum and maximum values of the gradient, I will now need to work out the maximum and minimum intercepts along my original intercept. To find the intercept of the minimum and the maximum I will read them of the graph as the lines cross the T2 axis.
Maximum intercept = 0.075
Minimum intercept = -0.023
Original intercept = 0.030
From the values above I know I have got an error in my intercept value, which is calculated below:
Maximum error = 0.075−0.030
= 0.045
Minimum error = 0.023−0.030
= -0.007
Therefore the in the intercept is +0.045 and -0.007.
As we know there is an error in the intercept this means that there will be the same error in the effective mass. Therefore I am now going to calculate the maximum and minimum effective mass along the original.
Maximum ms
Minimum ms
Original ms
My value of effective mass is 0.020kg. According to the theory it should be a third of its original mass. I have got an error in my value of effective mass, which I have calculated below:
Maximum error = 0.049−0.020
= 0.029
Minimum error = 0.005−0.020
= -0.015
This means that the value of effective mass could be +0.029 and -0.015 of the original value. As I said above the value of effective mass should be a third of the actual mass of the spring. The mass of the spring is 0.047kg;
The calculation above shows that the value of the effective mass should be 0.016kg according to the theory that states that the value of effective mass should be a third of its actual mass. The value that I obtained is 0.020kg, which is close to the value that I should get. Therefore taking into account the error bars on the extension axis were not drawn due to being too small, my value is quite accurate. The value of the effective mass shows that there was 0.020kg mass of the spring was undergoing simple harmonic motion with the rest of the system.
Evaluation
Now I am going to evaluate my experiment. Overall my experiment was quite good, as it can be seen from the graph and the results. There were a few errors in the equipment that I had to take into account. These errors are the systematic errors. My systematic errors were very small so this means that my measurements were accurate. I could have a high random error, as when I carried out this experiment there were a lot of people in the laboratory, which caused a lot of distraction hence increasing the reaction time to stop the stopwatch. If I had to this experiment again I would try to improve the following things as I think these things can make this experiment more accurate: -
- I would use a position transducer which will be connected to the data logging equipment. This will enable my graph to be drawn on the data logger as the experiment is being done. I could then read the values of at a set number of time periods. The data logging equipment will decrease the errors as everything is done using the advance technology. The accuracy will be improved as the data logging equipment will have a better reaction time then the experimenter.
- Instead of going up in 50 grams, I would go up in 20 grams. This decision is entirely due to the fact that when using the position transducer the maximum mass that can be added is 250 grams as mentioned in the preliminary experiment. Anything above 250 grams will affect the results because the position transducer limits the amplitude of the oscillation.
- Following on from the above when the amplitude is affected, it is called damping. Therefore to prevent damping I could try doing the experiment in a vacuum, this will cause no damping because there will be no resistive forces on the system. The values on the time period will be very accurate and the amount of error will be very small.
- When reading the length of the spring using a meter ruler the value might be slightly off because of the parallax. Therefore to be accurate I will use two rulers one upright next to the spring and the other to level off the reading from the spring. This will minimise the error even more for the extension axis.
- I would use a point mass instead of using a flat bass mass as the centre of gravity is right in the middle and therefore the mass is evenly spread out.
- I would try to use a bigger range on my graph so I could plot error bars on both axis. It will also allow me to use percentage errors from all the equipment, therefore by using a large scale I would be able to take into account all the errors.