speed = distance/time
EQUIPMENT
CARD
LIGHT GATE
CLAMP STAND
CLAMP
CARPET
BLUE TACK
READER (PC)
METER STICK
METHOD
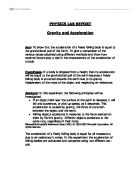
attach blue tack to the bottom of the piece of cardboard to reduce the direction the cardboard fall in and to make sure it passes through the light gates as straight as possible. the piece of cardboard measures 5cm by 10cm. The Light Gate was set up 15cm off the ground and was attached to a clamp stand to keep it steady. Light gates were used in this case as they are incredibly precise and accurate this eliminates human error. The light gate works by passing a laser beam between the two sensors and as an object passes through it determines how much of the beam was cut off and therefore works out the velocity. I attached a meter rule with a clamp on the clamp stand as well to measure the distance we were going to drop the object from. clamping it to the stand makes sure it is straight and steady. I dropped the card every 10 centimetres up the ruler up to 80 cm . I dropped the card through the light gate and read the measurement from the laptop. I repeated this 5 times for each of the 8 heights. Any anomalies were included.
ERROR MINIMIZATION
The experiment was carried out in a group so there was a person dropping the cards steadily and a person reading off the laptop. The Third person held a ruler in place to indicate the next drop heights. The person dropping it was kept constant . The air pressure and temperature were kept constant as the experiment was done in a room.
RESULT
The results were not accurate at all and did not follow any pattern. This was Due to the card passing through gate on a slant and at various different angles every time and different parts of the card passed through the light gate at different drops so the reading was not accurate. This caused all the results to vary a lot. I decided not to go ahead with the results as there would be no conclusion that we could draw from it .
REVISED SET UP
The card was changed to the musket ball , It measures 10mm in diameter and is spherical. Since it is spherical it does not have corners so the chance of it having one side longer than the other is much less likely there for increasing the accuracy and validity of my results however the edges of the ball still may cause an uncertainty , although it would have been significantly reduced. there was also a box added to the setup to make sure the ball does not bounce off the table and roll elsewhere, or injure someone.
REVISED EQUIPMENT
ball
Clamp stand
Box
Carpet
Light gate
PC
Thin clamp
Meter stick
REVISED METHOD
I am repeating each drop height 5 times at 8 different heights as before. The decimal places that the results were being measured to were also increased to 2 decimal places rather than one as this produces more accurate results.
ERROR MINIMIZATION
The experiment was carried out in a group again , so there was a person dropping the ball steadily and a person reading off the laptop. The Third person held a ruler in place to indicate the next drop heights. The person dropping it was kept constant . The air pressure and temperature were kept constant as the experiment was done in a room.
RISK ASSESSMENT
THE TABLE AND GRAPHS INDICATING THE REPEAT EXPERIMENT USING THE BALL INSTEAD OF THE CARD.
These results are of the repeated experiment , with the ball . this has produced better results . There is a trend between the drop height and velocity as can be seen on the drop height and velocity graph and drop height and velocity squared as can be seen on the drop height and velocity squared graph. As the drop height increases so does the velocity.
ANOMALIES
there are a couple of anomalies in this data. These could be caused by an added force being applied to the ball when dropping it , this added force along with the force of gravity increased the speed of the ball more than it would have been under only gravity.
Another reason might be that only the edge of the ball may have passed through the laser again causing the velocity to be higher than it should.