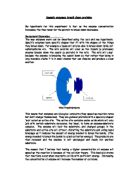
Predicted Graph:
Concentration of enzyme (protease)
This is the predicted graph for the experiment, and we can see from it that the concentration goes up directly with the volume of amino acid produced, and the line becomes horizontal when the maximum capacity is reached, and there are no more protein substrates to the broken down. We can also see that the graph passes through the origin, and the reason for this is that when the concentration of enzyme is zero, the volume of amino acid produced is also zero.
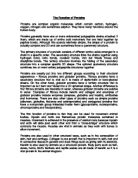
Variables:
Temperature
Enzymes are affected by their surrounding temperature.
As the temperature increases, the rate of reaction increases, this is because there are more collisions as the molecules gain more kinetic energy and move around faster.
If the temperature becomes too high, the enzyme will denature, and stop functioning. This is because the shape of the active site has been altered.
The optimum temperature for most enzymes is around 40ºC
pH
The optimum pH for the majority of enzymes is neutral (pH 7)
Most enzymes become denatured if the pH varies too far off normal.
The enzymes become denatured if the solution is too acidic or too alkaline. This is because the acidic and alkaline ions are attracted to the polypeptide chains inside the amino acids. This results in the bonds being damaged, and the active site of the enzyme being destroyed.
Stomach enzymes work best at pH 2, which is very low, and they get denatured at pH 6.
Concentration of enzyme
The rate of reaction depends upon the amount of amino acid formed within a certain time period.
The amount produced depends upon the number of substrates that bonds with the enzyme molecules.
There are more enzyme molecules present at a higher concentration
If there are more enzyme molecules, there is a greater chance of more substrate molecules colliding with an enzyme and therefore the reaction is faster.
If there are too many enzyme molecules for the amount of substrates, then the rate of reaction will stop increasing because there will be surplus enzymes.
Competitive inhibition
Enzymes only allow the correct substrate to fit into their active site, which is known as enzyme specificity.
If another substrate molecule with a similar shape enters the active site of an enzyme, it will compete with the correct substrates for the active site.
The molecules of the inhibitor allow much fewer desired substrates to enter the active sites of enzymes, and therefore the reaction is slowed down greatly.
Preliminary Experiment:
The aim of the preliminary experiment was to find out how many repeat readings could be taken on each petri dish, without the results interfering with each other. Also we could see rough values for the amount of amino acid that was to be produced.
Apparatus:
6 x Petri Dish
Jelly (Gelatine)
Protease enzyme
Water
Corer
Pippette
Calibrated tip ends
Combi Plate
Syringe
Method:
The packet of jelly was placed in a beaker, and boiling water was poured over it
The mixture was the stirred in opposite directions, to ensure all the jelly was dissolved in the water.
The jelly was then poured into a petri dish, and the dish was placed in the refridgerator and left to set.
When the jelly had set, 6 wells were pierced in the dish, 5 around the outside and 1 in the centre.
The different concentrations of protease were prepared in the combi plate, and in order to create the different concentrations, the protease enzyme was mixed with pure water. For example, to create 20% protease, 0.02 ml of enzyme was mixed with 0.08 ml of water.
Each of the 5 outer wells were filled with a different concentration of protease ranging from 20% to 100%. The centre well was filled with 0% protease (pure water).
The plates were then left in the refridgerator.
Diagram for preliminary experiment:
Preliminary results:
Observation/Conclusion:
We observed that the protease enzyme had converted the gelatine into amino acid. We then observed that the higher the concentration on protease enzyme, the larger the halo formed around the well. The main reason for this was because in the higher concentrations of enzyme, a larger amount of protein (gelatine) was converted in a quicker time, as there were more enzyme substrates in a higher concentration of protease.
Evaluation:
The preliminary experiment was carried out effectively and accurately. The preliminaries showed us the maximum amount of enzyme that the wells could handle. As the volume of enzyme had to stay constant throughout, I chose 0.1ml, as it was the maximum volume that the well could handle. This meant that the total volume of the mixture of protease and water should add up to 0.1ml (0.1cm3) We also came to realise that there would only be space for four wells for the highest concentration of protease (100%), so therefore all of the dishes were to have four wells pierced in them to ensure a fair test. When we were measuring the amount of amino acid produced, we realised that it would be much more accurate to use a calibrated pipette end than without one. These amendments will be incorporated in the actual experiment.
Final range of values:
The table on the previous page shows the final range of values that were to be incorporated in the experiment.
Main experiment:
Apparatus:
6 x Petri Dish – to contain the jelly and the wells with protease enzyme
Jelly (Gelatine) – protein to be converted into amino acid by protease enzyme
Protease enzyme – used to convert gelatine into amino acid
Water – to mix with protease enzyme when calculating concentrations
Corer – to pierce the jelly and create the wells
Pippette – to measure the amount of amino acid produced, and suck it from and squeeze it into the wells.
Calibrated tip ends – to ensure accurate measuring of amino acid produced.
Combi Plate – used for mixing different concentrations of protease enzyme.
Syringe
Diagram:
Method:
Firstly, the jelly had to be prepared, and then poured into the petri dishes.
The packet of jelly was placed in a beaker, and then boiling water was added.
The mixture was the gently stirred in opposite directions in order for the jelly to dissolve in the water.
The jelly was then poured into the petri dishes, ensuring that the same volume of jelly was in each dish, which made it a fair test.
The jelly was left in the refrigerator to set. (This process took about 48 hours)
When the jelly had set, four wells were pierced in each petri dish using a corer.
The different concentrations of protease were calculated, and then mixed. The protease was mixed in a combi plate. Each well was filled with 0.1 ml of protease enzyme, so if we wanted to mix 40% protease, we would take in 0.04 ml of protease enzyme in the syringe tip and 0.06ml of water. This would then add to 1ml, and it would be squeezed into the well, and it would be 40% concentration.
Combi plate diagram:
The same process was used to calculate the other concentrations of protease enzyme, and fill the wells in the dishes.
When all the wells had been filled with different concentrations of protease, the dishes were placed back into the refrigerator.
When they were taken out, the amount of amino acid was measured using a syringe. The amino acid was sucked out of the wells, and the reading on the syringe was taken, then the amino acid was squeezed back into the wells and placed back in the refrigerator.
Safety:
Protease enzyme is a hazardous and irritant substance. If it manages to enter the eye it can cause permanent blindness. To guard against this, safety goggles are worn. As it is an irritant, if it touches the skin it can cause irritation. Therefore if any protease enzyme ever came into contact with the skin, it was washed off immediately. When the gelatine was mixed with the boiling water, we had to be extremely careful not to spill any of the boiling water and scald the skin. Also, normal laboratory rules applied to the experiment, to guard against any injuries.
Fair testing:
To ensure that the experiment was a fair test, only a single variable was changed throughout, and the other variables must be kept at a constant during the experiment. For example, the pH or the temperature could not be changed, as this would lead to an unfair test. Repeat readings were taken to improve reliability of the data. Repeat readings and an average do not only give more accurate results, but the also reduces the chance of obtaining anomalous data, as if one reading was drastically different from the other two, we could identify it as an anomaly. Any anomalous data that was obtained would be recognized but not used, so it could not effect calculations for averages. When the different concentrations of protease were being mixed, we had to ensure that a different calibrated tip end was used every time to avoid the mixing of different concentrations of enzyme, which would ensure a fair test.
Analysis
My prediction stated the following:
I predict that as the concentration of protease enzyme is increased, the faster the rate of reaction will be. The diagram below shows how enzymes work. Molecules are constantly in motion, and colliding with each other. When a substrate molecule (protein) bumps into a molecule of the right enzyme, it fits into a depression on the surface of the enzyme molecule. This depression on the surface is called an active site. The reaction then takes place and the molecules of product (amino acids) leave the active site, freeing it for another substrate molecule to enter. The active site of a particular enzyme has a specific shape into which only one kind of substrate will fit. This substrate fits into the active site rather like a key fits into a lock. This is why enzymes are specific in their action. When an enzyme is denatured by heat, the active site shape is changed, so the substrate molecules no longer fit into it.
Predicted Diagram:
The reason why I predict that as the concentration of enzyme goes up, the rate of reaction will go up is because, as the enzyme concentration increases, there are more protease enzymes present in the solution. This would result in a greater number of enzymes being able to break down the proteins into amino acids, and therefore gaining a higher volume. We can therefore see that if the concentration of enzyme is lower, the volume of amino acid produced will also be lower. The reaction can only occur if there is an enzyme-substrate complex formed, e.g. a protein substrate binding with an enzyme molecule. It must be ensured that all other variables are kept constant, which greatly decreases the chance of inaccuracies, as these other variables would affect the rate of breaking down the protein. If the concentration of enzyme was raised greatly, the reaction speed would not continue to increase, because there would be more active sites than substrates, and this would result in surplus enzymes, as there will already be enough enzymes to break down the protein substrates. This would mean that there will be a certain concentration of enzyme, which would give us the highest reaction speed, and even if the concentration were raised even more from this point, the reaction speed would not increase. I predict that there will be positive correlation, to the extent that when the concentration is doubled, the rate of reaction is doubled. Therefore as double the amount of enzymes are introduced, double the amount of protein will be broken down, until the maximum capacity is reached.
Predicted Graph:
Concentration of enzyme (protease)
This is the predicted graph for the experiment, and we can see from it that the concentration goes up directly with the volume of amino acid produced, and the line becomes horizontal when the maximum capacity is reached, and there are no more protein substrates to the broken down. We can also see that the graph passes through the origin, and the reason for this is that when the concentration of enzyme is zero, the volume of amino acid produced is also zero.
Conclusion:
We can see from the graphs shown in the obtaining evidence section that the diameter of well and volume of amino acid produced increase along with the concentration of protease. As the graphs come to an end, we can see that the best fit lines begin to level off, but not completely. This agrees with my prediction apart from in the prediction the best fit line was said to level off. However as the volume and diameter of well increased evenly with the concentration of protease, we can call the prediction a success.
We can see from the graphs that there is a clear pattern in the results. However, in the prediction, it was stated that as the concentration doubles so would the amount of amino acid produced. From the obtained data, there is not sufficient data for us to prove this. The data only suffices for us to say that as the concentration increases, so does the volume of acid produced.
We can see from the table of results that according to the prediction, 20% protease – 40% protease, the amount of amino acid produced should double, and from 40% to 80%. However we can see that this is not the case, as the result seems to be less than double.
The best fit lines on the graphs begin to level off as stated in the prediction, however they do not completely level off due to there never being a surplus amount of protease enzymes. There are never more protease enzymes than substrate molecules, even in 100% protease. However when there is 100% protease solution available, there are many more enzymes to take part in collisions, and therefore more reactions take place within a certain time period.
The way that the gelatine is broken down by the protease is the protease diffuses through the gelatine and the peptide bonds that hold the gelatine structure together are broken. When 100% protease was used, the solution diffused quicker, due to a steeper concentration gradient. Therefore in the higher concentration of enzymes more peptide bonds were broken in a certain time period, than with a lower concentration of enzymes. When the peptide bonds were broken the resultant product was amino acid. We can say that with a faster rate of diffusion, the enzymes were able to get through more gelatine, and convert more of it into amino acid. Also, if more protease diffuses through the gelatine, the diameter of the wells would increase aswell. This is because, with a faster rate of diffusion, more enzymes were able to get through more gelatine in the jelly, and therefore with the higher concentrations of protease solution, the diameter of the wells was larger.
The reason why the trend lines on the graphs are straight is because as there is a higher concentration more peptide bonds are being broken because there is a bigger difference in the concentration gradient. However, the line will start to level off and become a curve because as the concentration of protease increases, the rate of reaction decreases due to the increase in size of the halo, and the larger volume of amino acid in the halos for the enzymes to diffuse through. This therefore slows down the diffusion rate. If the concentration of the enzyme results in there being more active sites than protein substrates then the rate of reaction does not increase because there are more active sites. The prediction was the the volume of amino acid produced was directly proportional to the concentration of protease was theoretically correct, but the results only partially showed this.
The results did show enough evidence to back the theory that volume of amino acid produced increased with concentration. Overall I can call my prediction a success.
EVALUATION
The investigation was carried out successfully and the results were recorded in graphs. The results were close to the predicted results, and the best fit line on the graph was very similar to the predicted best fit line. We can therefore say that the results were accurate. . This can also be proved by the fact that I could only identify 2 anomalies. The 2 anomalies reduced the reliability of my results but the results were generally accurate. 0.68 and 0.80 cm3, for volume of amino acid produced, were my 2 anomalies because they were further away from the rest of my results and my average. Besides from these two anomalies, the results were close to the predicted results and the average. We can see this from the best fit lines on the graph, all the data points are very close to them.
When a concentration of 20% protease enzyme was used, the results were extremely accurate as they were only 0.04cm3 or below from the average.
However, with 80% protease used, the results were slightly more inaccurate, but still very reilable. Even discounting the anomaly (0.80 cm3), the results were still only 0.08cm3 or less, away from the average.
Even though the results were fairly accurate, they were not completely accurate, and there were a number of amendments that could have been made. Here is a list of the errors that were made in the investigation:
I think the main problem that could have led to a series of errors during the investigation was the lack of accuracy of the equipment used. When the concentrations were mixed, this was fairly inaccurate, as it was very hard to measure such small quantities of solution. Instead of a pippette, another instrument could have been used for measuring these small quantities of solution, such as a micro-pipette. We can say that this was the main error because, this error would have been encountered at the start of the experiment, and it would have accumulated as the investigation proceeded.
When the protease enzyme was squeezed into the wells, the wells were filled right to the brim, and this could have caused them to overflow. If this occurred, this protease solution would escape the wells, and start to convert the jelly from outside the wells into amino acid, and this would give us an inaccurate reading of the amount of amino acid produced.
When the wells were pierced, they were not always made all the way through the gelatine, due to the lack of accuracy of the corer. This led to problems because then not the same amount of protease could be squeezed into those wells that had not been fully peirced.
Another error with the corer was that, if there was a bit of jelly stuck on it, and a well was pierced with it, the particular well may not have been completely circular, and this would have led to a false measurement for the diameter of the well at the end of the experiment. Another device could have been used to suck up the jelly from the wells, to give us a better measurement.
When the results were taken, the petri dishes were taken out of the refridgerator, and they were left at room temperature for about 90-120 minutes. This raised the temperature around the enzymes, and it was closer to their optimum temperature. This therefore led to an increase in amino acid production, and it also caused the gelatine to soften. The only real solution to this problem would have been to leave the plates in the refridgerator for a longer period of time.
It was nearly impossible to cut the wells and get out all the jelly with the corer because it was too soft. Therfore forceps had to be used to take out any excess jelly from the wells. This made the investigation more inaccurate, and increased the chance of anomalies being obtained.
The investigation was maintained as a fair test by keepin all the other variables the same, and using the same amount of protease when the different concentrations were mixed. Also, we can see from the obtaining evidence section that repeat readings were take to increase the accuracy and reliability of the results. Three repeat readings were taken for each concentration, and then an average from that. As there were only two anomalies encountered, more repeat readings were not necessary, as these anomalies were discarded.
Improvements that could have been made:
A calibrated pipette end could have been used in order to fill the wells with the solution. This would have decreased the chance of the wells overflowing.
If more time was available, the plates could have been left in the refridgerator for longer, to prevent the gelatine from melting. However this would have meant that the rate of reaction would have been slowed down significantly.
A sharper and more accurate cutting tool could have been used to make the wells exactly circular.
An instrument could have been used to suck out any surplus jelly that was left in the wells.
Anomalies:
As discussed in the errors section briefly, there were a number of reasons why anomalies occured:
The gelatine began to melt and the temperature was increased when the gelatine was removed from the refridgerator. This would have increased the amount of amino acid produced. Also when the plates were being carried, the protease sometimes spilt out onto the jelly, which caused further inaccuracy.
Due to the slightly different size of each well, there seemed to be a difference in the amount of diffusion, even with using the same concentration of protease.
Instrumental error caused inaccuracy, and a main reason why anomalies could have been encountered.
We can work out the instrumental error of the syringe by taking the accuracy of its measurement, and dividing it by the number of readings taken.
0.01/5 = 0.02%
The syringe was used three times (mixing concentrations, pouring solution into wells, and extracting and measuring amino acid from the wells), so we multiply 0.02% by 3.
We therefore obtain a final instrumental error for the syringe as 0.06%.